


As a fundamental resource for modern infrastructure development, the sand and aggregates industry plays an irreplaceable strategic role in the global processes of industrialization and urbanization. With the continued expansion of the global construction market, surging infrastructure demand in emerging economies, and mounting pressure for industrial transformation under carbon neutrality goals, the aggregates sector is confronting multiple challenges, including resource constraints, environmental regulation, and supply chain restructuring. This white paper adopts a global perspective to deliver an in-depth analysis of industry trends, offering valuable insights for investors and corporate decision-makers seeking to seize opportunities and lead the transformation in this evolving landscape.
1. Overview of Sand and Aggregates Industry
1.1 Basic Concept of Sand and Aggregate
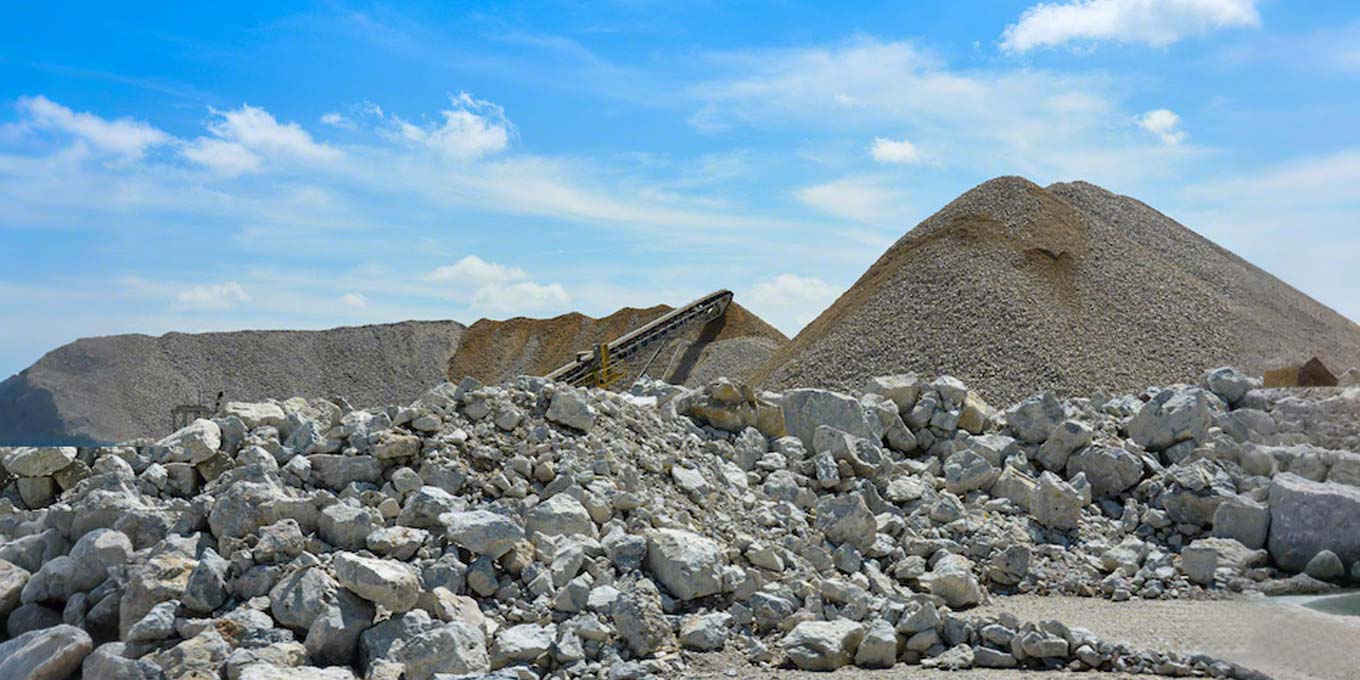
Sand and aggregates are granular materials derived from natural rocks and pebbles through processes such as crushing, screening, or natural weathering. They serve as essential raw materials in the production of concrete, asphalt, and roadbed construction.
| Classification criteria | |
|---|---|
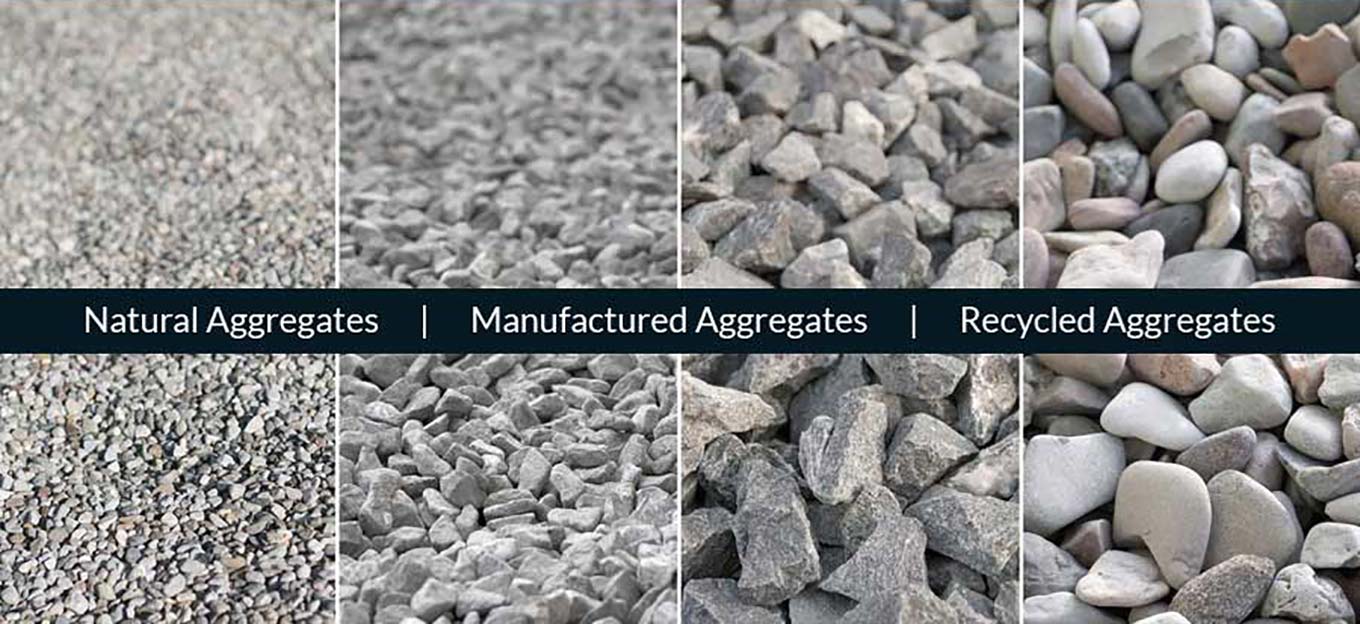
| By source and process | Natural aggregate: river sand, sea sand, mountain sand (needs to be cleaned to remove impurities, chloride ion content must be less than 0.02% to comply with EU EN 13242 standard). |
| Manufactured aggregates: they are produced by crushing rocks, and those with a crushing value below 12% can meet the requirements for high-strength concrete, in accordance with China’s national standard GB/T 14684. | |
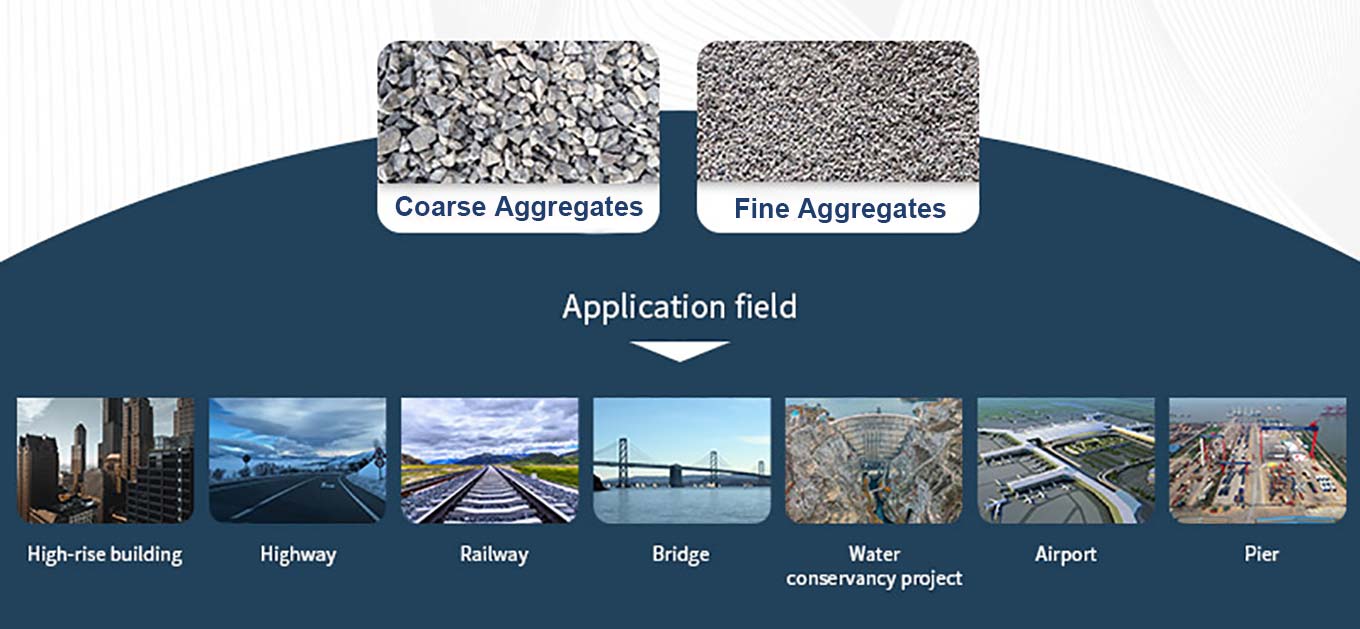
| By particle size specifications | Coarse aggregates: typically ranging in particle size from 0.15 to 4.75 mm, such as crushed stone and gravel, account for approximately 60% to 75% of the total volume of concrete. |
| Fine aggregates: With particle sizes ranging from 4.75 to 37.5 mm, such as river sand and manufactured sand, affect the workability and crack resistance of concrete. | |
| By application scenario | Construction sand: It must comply with ASTM C33 (United States) or GB/T 14684 (China) standards, with a crushing index of no more than 30%. |
| Sand used for asphalt applications: It must have a flat particle content of less than 12% to prevent pavement cracking and ensure structural integrity. | |
| Eco-friendly aggregates: It include recycled aggregates—with a construction waste recycling rate of ≥90%—and low-carbon aggregates produced at calcination temperatures of ≤800°C. |
Source
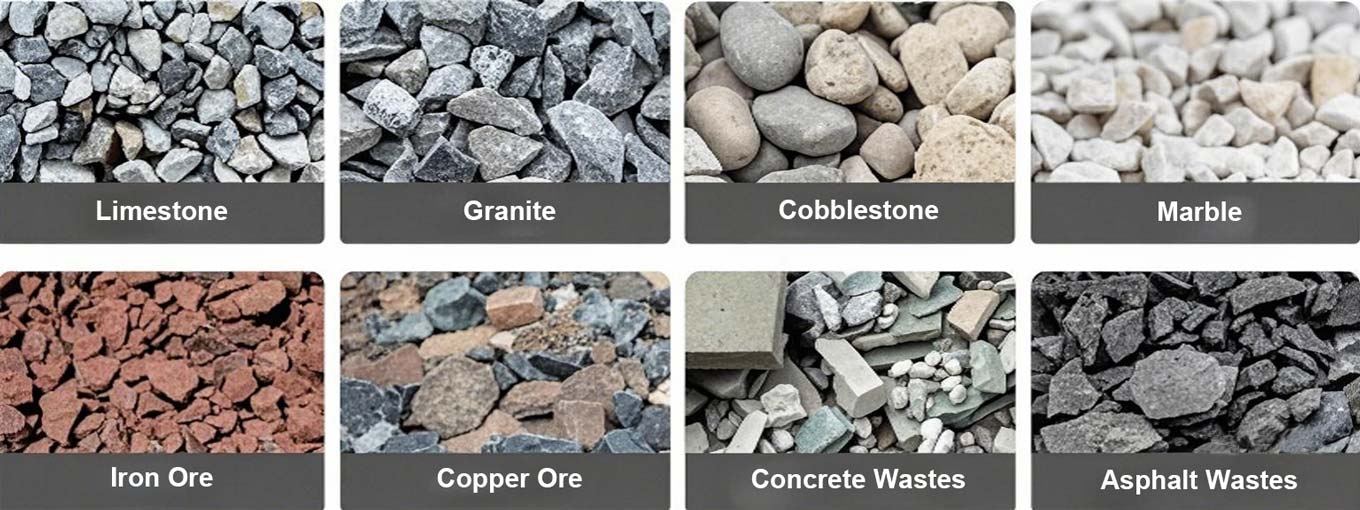
- Natural sources: Global sand and aggregate resources are primarily found in sedimentary rocks (such as limestone and sandstone) and metamorphic rocks (such as quartzite). The top ten resource-rich countries—including China, the United States, India, and Brazil—account for 75% of the world’s total reserves. River sand, valued for its rounded texture, is widely used in high-end construction; however, excessive extraction has caused ecological degradation. Seawater sand requires desalination treatment to prevent steel reinforcement corrosion.
- Artificial sources: These aggregates are produced by crushing mining waste rock, recycling construction debris (e.g., crushed concrete blocks), or processing industrial solid wastes such as steel slag and coal gangue.
- Extraction methods: The industry’s extraction is composed of 65% land-based open-pit mining, 25% riverbed and seabed dredging, and 10% recycling and reuse.
Production Process and Technical Parameters
The production process of sand and aggregates includes four stages: crushing, screening, washing, and environmental protection treatment. Technical differences directly affect costs and market competitiveness:
| Processes | Technical points | Differences in international standards |
|---|---|---|
| Crushing | – Coarse crushing: jaw crusher (energy consumption ≤1.5kWh/ton) | The EU requires that the noise level of crushing equipment should be less than 85 decibels (EN ISO 3744) |
| – Medium and fine crushing: cone crusher (yield ≥92%) | ||
| Screening | Vibration screening efficiency ≥98%, particle size tolerance controlled within ±10% | The US ASTM D2487 requires that the particle size matching rate should be ≥ 95% |
| Washing | Water washing to remove impurities (mud content <1%), but dry screening (MB value <1.5) is mostly used in water-scarce areas in Africa | The EU EN 13242 limits the chloride ion content to less than 0.02% |
| Environmental treatment | Tailing utilization rate ≥85% (Chinese standard), EU requires solid waste landfill rate <5% | The US EPA requires the installation of a dust collection system (efficiency ≥ 99%) |

- Construction industry: Aggregates account for 70% to 80% of concrete production, with a global annual consumption of approximately 3 billion tons.
- Transportation infrastructure: Road and railway subgrade materials represent 20% of aggregate demand. Crushed stone ballast for high-speed rail track slabs must meet a compressive strength exceeding 160 MPa, while aggregate size for highway base layers is strictly controlled between 20 and 40 mm.
- Water conservancy projects: Dams and port constructions require high-strength aggregates. Water conservancy projects in Southeast Asia’s Mekong River Basin account for 15% of aggregate consumption.
- Industrial applications: Uses include glass manufacturing (silica sand) and metallurgical auxiliaries (foundry sand), representing 5% to 8% of global demand.
1.2 Market Analysis
Demand Drivers
- Global infrastructure surge: Urbanization rates in developing countries, such as India and Southeast Asia—are increasing at an annual rate of 1.2% to 1.5%, while infrastructure renewal in developed countries, exemplified by the U.S. Infrastructure Investment and Jobs Act covering $1.2 trillion in projects, forms a dual growth driver.
- Low-carbon transition pressure: The European Union’s Circular Economy Action Plan mandates a 40% utilization rate of recycled aggregates from construction waste by 2030, driving technological upgrades in the aggregates production industry.
- Emerging sector demand boom: Demand in new energy infrastructure sectors, such as grout materials for wind turbine foundations and aggregates for photovoltaic support structures, is growing at an annual rate of 18%, fueling expansion in the high-end manufactured sand market.
Industry Chain Structure
| Core data | Growth logic | |
|---|---|---|
| Upstream | Global reserves of artificial sand raw materials are 150 billion tons (China) | Resource reserves are sufficient to support long-term supply |
| Midstream | China’s smart mine investment recovery period is 4-5 years | Technology cost reduction drives industry concentration |
| Downstream | Global recycled aggregate market size may reach US$150 billion in 2030 | Policy-mandated substitution + circular economy dividends |
1.3 Industry Market Size
The sand and aggregate market has grown strongly in recent years. Its size is expected to grow from $405.61 billion in 2024 to $433.28 billion in 2025, with a compound annual growth rate (CAGR) of 6.8%. The sand and aggregate market is expected to grow strongly in the next few years. By 2029, the market will reach $558.06 billion, with a compound annual growth rate (CAGR) of 6.5%.

The accelerated pace of global urbanization and the expansion of various infrastructure projects are key drivers of market demand. Both government and private sector investments in roads, bridges, residential, and commercial buildings have increased substantially, fueling higher demand for aggregates such as sand, gravel, and crushed stone. Construction activities in developing countries are rising in line with urbanization initiatives.
Furthermore, the reconstruction of aging infrastructure in developed countries is also contributing to market growth, ensuring sustained demand for high-quality aggregates to meet stringent construction standards and safety requirements.
1.4 Development Trends In The Next Five Years: Green, Intelligent, And Circular
Against the backdrop of accelerated global infrastructure expansion and mounting environmental constraints, the sand and aggregates industry is entering a new phase of transformation and upgrading. By 2030, five major trends are expected to shape the industry’s future:
Manufactured Sand to Surpass Natural Sand as the Mainstream Aggregate
To bridge the supply-demand gap, manufactured sand is emerging as the primary alternative. By 2027, manufactured sand is projected to account for over 50% of the global aggregate mix—and as high as 70% to 80% in countries like China. Advances in particle shape control, gradation consistency, and environmental performance are propelling manufactured sand toward a future of scaled, standardized, and intelligent production, reshaping the global aggregates landscape.
Green and Low-Carbon Development Becomes the New Benchmark
In Europe, the EU has introduced a new Sustainable Construction Products Regulation encouraging the use of low-carbon recycled materials. In China, the “Green Mine Construction Standard” mandates comprehensive green controls throughout the aggregate mining lifecycle—including extraction, transport, storage, and discharge.
Over the next five years, green certification is expected to become a baseline entry requirement. Traditional, resource-intensive operators will be phased out, while green aggregate bases and eco-friendly mining zones will benefit from expanded policy and financial support.
Intelligent Mining Systems Accelerate Implementation
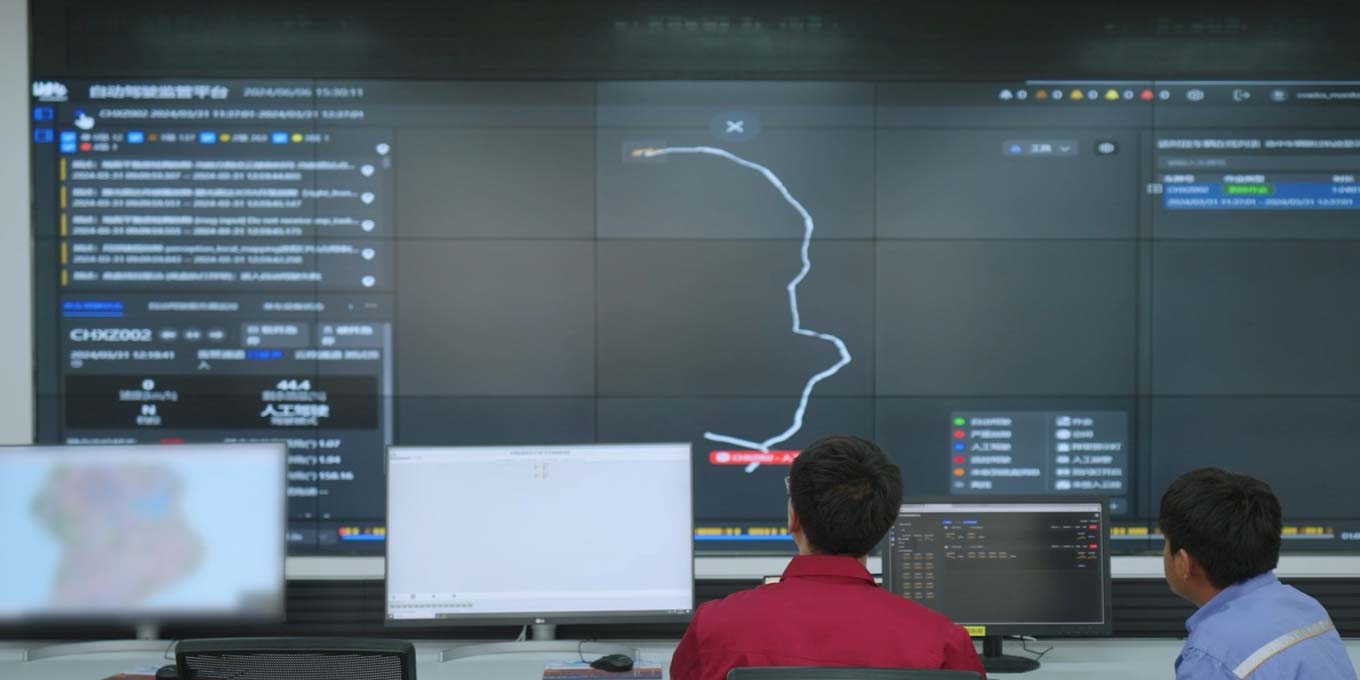
Smart mining demonstration zones have been established in China, Australia, South Africa, and elsewhere—featuring automated drilling and blasting, unmanned haulage fleets, and centralized remote-control centers. Industry leaders such as LafargeHolcim and Conch Group are spearheading the development of “smart aggregate plants.” By 2030, over 50% of major global aggregate producers are expected to achieve baseline digital operating capabilities.

Rapid Growth in Recycled Aggregates as Circular Systems Take Shape
According to the UNEP’s Sand and Sustainability report, recycled aggregates could supply 10% to 15% of global aggregate demand in the future. Developed nations such as Germany, Japan, and the Netherlands already exceed a 30% utilization rate, while emerging economies are accelerating the development of C&D recycling and aggregate certification standards.
Growing Regional Market Divergence
- Developing countries (e.g., Indonesia, the Philippines, Nigeria): Driven by demographic dividends and infrastructure investment, aggregate demand is growing at 7% to 10% annually.
- Developed countries (e.g., the U.S., Germany, Japan, France): Consumption is stabilizing, with greater emphasis on particle shape, cleanliness, carbon footprint, and recycled content—fueling demand for high-performance aggregates.
Regional policy frameworks will further influence market dynamics. For example, the U.S. Infrastructure Investment and Jobs Act (IIJA) unlocks over $1 trillion in market potential, while China’s 14th Five-Year Plan for New Urbanization will trigger a second wave of aggregate demand in central and western provinces.
1.5 Regional Market Analysis
The global sand and aggregates market is exhibiting a distinct trend of regional differentiation. Market demand and growth rates vary across regions due to differences in infrastructure development, resource management policies, and environmental regulations. The following section provides a detailed analysis of key regional markets:
The Asia-Pacific region is the largest and fastest-growing market for sand and aggregates globally, accounting for over 60% of the total market volume. The region’s robust demand is driven by accelerating urbanization and sustained infrastructure investment.
- China: China is the world’s largest producer and consumer of aggregates, with an annual output exceeding 20 billion tonnes—approximately half of global production. The government’s strong push for infrastructure development, particularly in urbanization, transportation networks, and new urbanization initiatives, continues to drive aggregate demand.
The share of manufactured sand is steadily increasing due to restrictions on natural sand mining and stringent environmental regulations. By 2025, manufactured sand is expected to account for more than 60% of China’s aggregate market. Additionally, government policies promoting green building and sustainable development are fostering the use of recycled and environmentally friendly aggregates. - Indonesia: The construction of the new capital city, Nusantara, is projected to generate aggregate demand of 300 million tonnes between 2025 and 2030.
- Malaysia: Malaysia’s aggregate market has shown stable development, with current annual consumption reaching approximately 220 million tonnes, and projected to rise to 280 million tonnes by 2025—a compound annual growth rate of around 5%. Demand is particularly strong in Peninsular Malaysia, while Sabah and Sarawak (East Malaysia) are emerging growth regions due to accelerated industrial and transport infrastructure development.
Sustainability concerns are increasingly influencing policy, with gradual uptake of manufactured and recycled aggregates. By 2027, manufactured sand is expected to represent over 35% of total aggregate demand.
- Philippines: The ongoing implementation of the “Build, Build, Build” national infrastructure program has spurred large-scale development in roads, railways, airports, and seaports. Aggregate demand continues to rise. With uneven natural sand distribution and tighter environmental oversight, manufactured sand’s market share is expanding steadily, projected to exceed 45% by 2026.
- Pakistan: The China-Pakistan Economic Corridor (CPEC) infrastructure projects are driving significant demand for aggregates. However, domestic production capacity remains insufficient, with over 60% of aggregate supply dependent on imports.
- Bangladesh: Urbanization is advancing rapidly at an annual rate of 3.5%, creating a shortfall of approximately 1 billion tonnes per year in manufactured sand.
Across Southeast Asia, including countries such as Vietnam and Myanmar, there has been a marked increase in infrastructure development in recent years. The acceleration of transportation projects, including high-speed railways, airports, and ports, has triggered explosive growth in aggregate demand. In Vietnam, for example, the government’s “National Transport Development Plan” is expected to drive annual aggregate demand growth of 8% to 10% over the next five years.
The sand and aggregates market in Latin America is shaped by a dual influence of infrastructure development and policy volatility. While overall demand remains relatively stable, certain countries and regions within the continent exhibit strong growth potential.
Large-scale infrastructure investments are underway in countries such as Brazil, Mexico, and Chile, particularly in transportation, housing, and public utilities. With the gradual implementation of the Initiative for the Integration of the Regional Infrastructure of South America (IIRSA), the aggregates market is showing signs of recovery. In Brazil, the market is expected to grow at an average annual rate of 4% to 5% over the next five years.
- Argentina: The national infrastructure plan “Argentina 2030” is projected to boost aggregate demand. However, the country’s economic instability—marked by hyperinflation rates exceeding 100%—poses significant challenges to market consistency and investment.
- Chile: The demand for aggregates is supported by large-scale copper mining activities. Nevertheless, the industry is subject to stringent environmental regulations, including requirements for tailings reuse rates to exceed 70%, which impacts traditional aggregate sourcing and promotes the adoption of sustainable alternatives.
The CIS region—including countries such as Russia, Ukraine, and Kazakhstan—is emerging as a new growth frontier for the sand and aggregates industry. Driven by geopolitical realignment, accelerated infrastructure investment, and strategic resource development, the region holds considerable market potential.
- Russia: As the world’s fourth-largest producer of sand and aggregates—with an annual output of approximately 6 billion tonnes—Russia’s demand is being fueled by the Arctic Development Program and major infrastructure investments across the Far East. Annual aggregate demand is projected to grow by 5% to 7%.
- Kazakhstan: As the largest aggregates market in Central Asia, Kazakhstan benefits from China’s Belt and Road Initiative, including key projects such as the China-Kazakhstan Lianyungang Logistics Cooperation Base. These initiatives are driving increased demand for aggregate exports, with an anticipated annual growth rate of 8%.
- Ukraine: Post-war reconstruction plans (2023–2029), with a committed investment of USD 30 billion, are expected to result in a surge in aggregate demand. However, current production capacity has only recovered to 30% of pre-war levels, indicating a significant supply-demand gap and potential for rapid expansion.
The North American sand and aggregates market is relatively mature but continues to exhibit stable growth driven by policy reforms and ongoing infrastructure projects.
- United States: The U.S. ranks as the world’s second-largest consumer of sand and aggregates, with an annual consumption of approximately 3 billion tonnes. In recent years, the government’s Infrastructure Investment and Jobs Act (IIJA) has significantly boosted infrastructure development across roads, bridges, water systems, railways, and more. This legislation is expected to inject over USD 50 billion into the aggregates market. Concurrently, demand for green aggregates and recycled materials is steadily rising, particularly in response to tightening environmental regulations and carbon emission standards.
- Canada: Canada’s aggregates market produces close to 500 million tonnes annually, characterized by a strong emphasis on green mining and recycled aggregates projects. The Canadian government has implemented proactive measures to promote sustainable resource utilization, including stringent environmental impact assessments and ecological restoration requirements for mining operations. The use of recycled aggregates in Canada is well-established, and with continued strengthening of environmental policies, demand for green building materials and circular economy products is anticipated to grow further.
The European market is overall stabilizing, with annual sand and aggregate consumption maintained between 3 to 3.5 billion tonnes. As one of the earliest regions to implement environmental policies, Europe is leading the green transformation of the aggregates sector.
Major economies such as Germany, France, and Italy account for the majority of aggregates consumption in Europe. Their markets are primarily influenced by sustainable development goals, environmental regulations, and green building standards. Germany, in particular, has pioneered construction waste recycling, with recycled aggregates expected to exceed a 25% market share by 2025.
The European Green Deal imposes stringent environmental requirements on the construction industry, accelerating the sustainable transition of the aggregates sector. In the coming years, carbon footprint reduction, resource recycling, and the adoption of low-carbon aggregates will become critical competitive factors in the market.
| Country | Policy focus | Opportunities for Chinese companies |
|---|---|---|
| Germany | Annual demand of 450 million tons (35% recycled aggregate) | Construction waste recycling rate ≥ 90% Invest in recycled aggregate production line (payback period 3-4 years) |
| Poland | Annual demand of 300 million tons (120 million tons of machine-made sand gap) | Subsidy plan for small and medium-sized enterprises (30% subsidy for equipment purchase) China’s cone crusher market share exceeds 50% |
| Netherlands | Annual demand for port infrastructure of 150 million tons Carbon neutral port certification (requires sand and aggregate carbon footprint ≤ 0.5 tons CO₂/ton) | Low-temperature calcined sand export (premium 25%) |
| Sweden | Green Mining Act (ban on natural sand mining in 2025) Machine-made sand replacement rate ≥ 80% | Mobile crushing stations cover scattered mines |
The sand and aggregate market in Africa is in a stage of rapid development. With the acceleration of urbanization and the increase in infrastructure investment, the demand for sand and aggregates is rising year by year.
| Country | Market demand | Core driving factors | Opportunities for Chinese companies |
|---|---|---|---|
| Egypt | Annual demand of 500 million tons (2025) | New capital construction, Suez Canal Economic Zone | China Building Materials invests in 5 million tons of smart mines |
| Kenya | Annual demand of 300 million tons (annual average increase of 10%) | Mombasa Port expansion, East African railway network | Mobile crushing plants cover scattered mines |
| Ethiopia | Annual demand of 250 million tons (Grand Renaissance Dam project) | Hydropower infrastructure, urbanization rate increases by 4.5% annually | Chinese companies build factories locally (avoid import tariffs) |
| Nigeria | Annual demand of 600 million tons (mechanical sand accounts for less than 10%) | Moro River Steel Plant, Lekki Deepwater Port | China’s mechanical sand exports (FOB price of US$80/ton) |
- Saudi Arabia: Saudi Arabia is actively promoting large-scale urban development, infrastructure projects, and economic diversification plans, which will further drive demand in the sand and aggregates market. Major infrastructure developments—particularly in railways, ports, and airports—are expected to push annual aggregates demand growth beyond 7%.
- United Arab Emirates: Following the Dubai Expo, the UAE’s infrastructure focus has shifted toward renewable energy projects such as solar parks, resulting in increased demand for specialty sands, notably quartz sand.
- Iran: Sanctions have constrained domestic production capacity in Iran; however, the “Look East” policy has stimulated sand and aggregate trade with China, with imports increasing by 25% in 2023.
- Australia: Aggregate demand is primarily driven by mining infrastructure projects, such as iron ore and coal transportation, as well as urban renewal initiatives. Manufactured sand accounts for over 70% of the aggregates supply.
- New Zealand: With stringent environmental regulations in place, recycled aggregates usage exceeds 40%. However, domestic production capacity remains insufficient, resulting in reliance on imports.
2. Technological Trends
The aggregates industry is accelerating its transition toward intelligent operations, low-carbon development, and efficient resource utilization. Technological innovation is not only enhancing production efficiency but also playing a critical role in addressing resource constraints and environmental challenges. This section analyzes the industry’s technological evolution across key technologies, environmental solutions, and leading R&D entities.
2.1 Development of Key Technologies
Intelligent Mining and Processing: Enhancing Efficiency and Safety
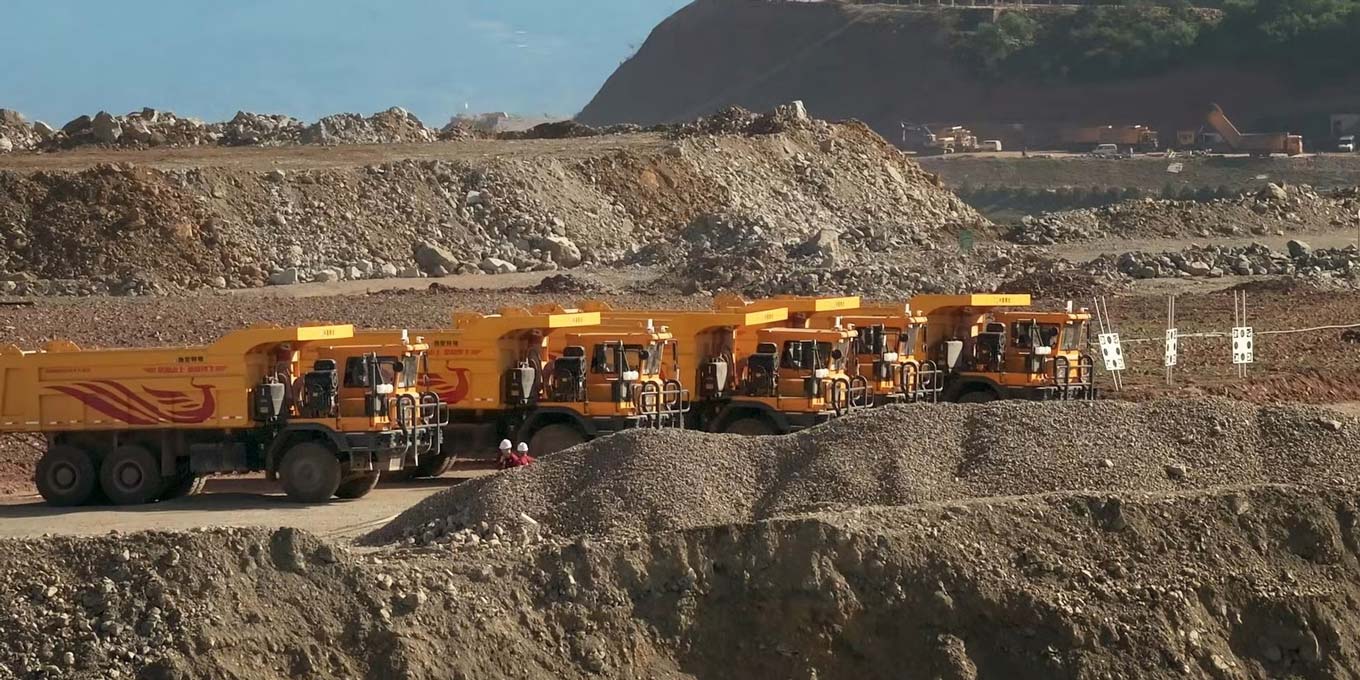
- Unmanned Mines: Leading global enterprises (e.g., Lafarge Holcim) are deploying autonomous haulage trucks and AI-based dispatch systems, boosting mining efficiency by 20%–30%.
- Digital Management: Blockchain is being applied to raw material traceability (e.g., Australia’s blockchain-based aggregate traceability platform), while ERP system penetration has surpassed 65%.
Breakthroughs in Manufactured Sand Technologies: Improving Quality and Promoting Circular Utilization
- Gradation Optimization: Nano-modification technology has increased the compressive strength of manufactured sand concrete by 15% while reducing costs by 8% (example: Zoomlion, China).
- Fine Sand Recovery: Centrifugal separation technologies have raised wastewater recycling rates to 90% and reduced solid waste discharge by 70%.
Digital Technologies: Precision Production and Quality Control
- Online Monitoring Systems: Real-time Particle Size Distribution Monitoring: Accuracy deviation <1%, boosting compliance with China’s GB/T 14684 standard to 98%. Chloride Ion Content Detection: Monitoring accuracy ±0.001%, helping to avoid EU market rejection risks (penalties may exceed 20% of shipment value).
- Sand for 3D Printing: Silica sand with ≥99% purity; BASF’s specialized equipment exports from Germany have grown 30% annually, with a technology premium of up to 40%.
2.2 Environmental and Sustainable Development Technologies
Zero-Emission Processes
- Carbon Capture Technologies: HeidelbergCement in Norway is piloting carbon capture at aggregate mines, reducing carbon emissions per ton of aggregate to 0.8 kg (industry average: 1.5 kg).
- Zero-Wastewater Discharge Systems: At China’s Yellow River Cement Plant, a combination of sedimentation and reverse osmosis enables 100% reuse of process wastewater, saving 1.2 million tons of water annually.
- Policy Driver: The EU Industrial Emissions Directive mandates that by 2030, aggregate producers achieve a wastewater reuse rate of ≥90%.
Low-Carbon Production Techniques
- Water-Free Sand Production: Dry screening combined with electrostatic dust removal. This method, adopted in Saudi Arabia’s NEOM City project, reduces water consumption by 70% and dust emissions by 90%.
- Low-Temperature Calcined Sand: Calcination temperature reduced from 1,200°C to 800°C, cutting energy use by 40%; North American markets pay a 25% premium for such products (Chinese exports of this technology grow at 20% annually).
- Technological Breakthrough: The Chinese Academy of Sciences has developed microwave-assisted calcination, achieving an additional 20% energy savings.
Solid Waste Recycling and Reuse
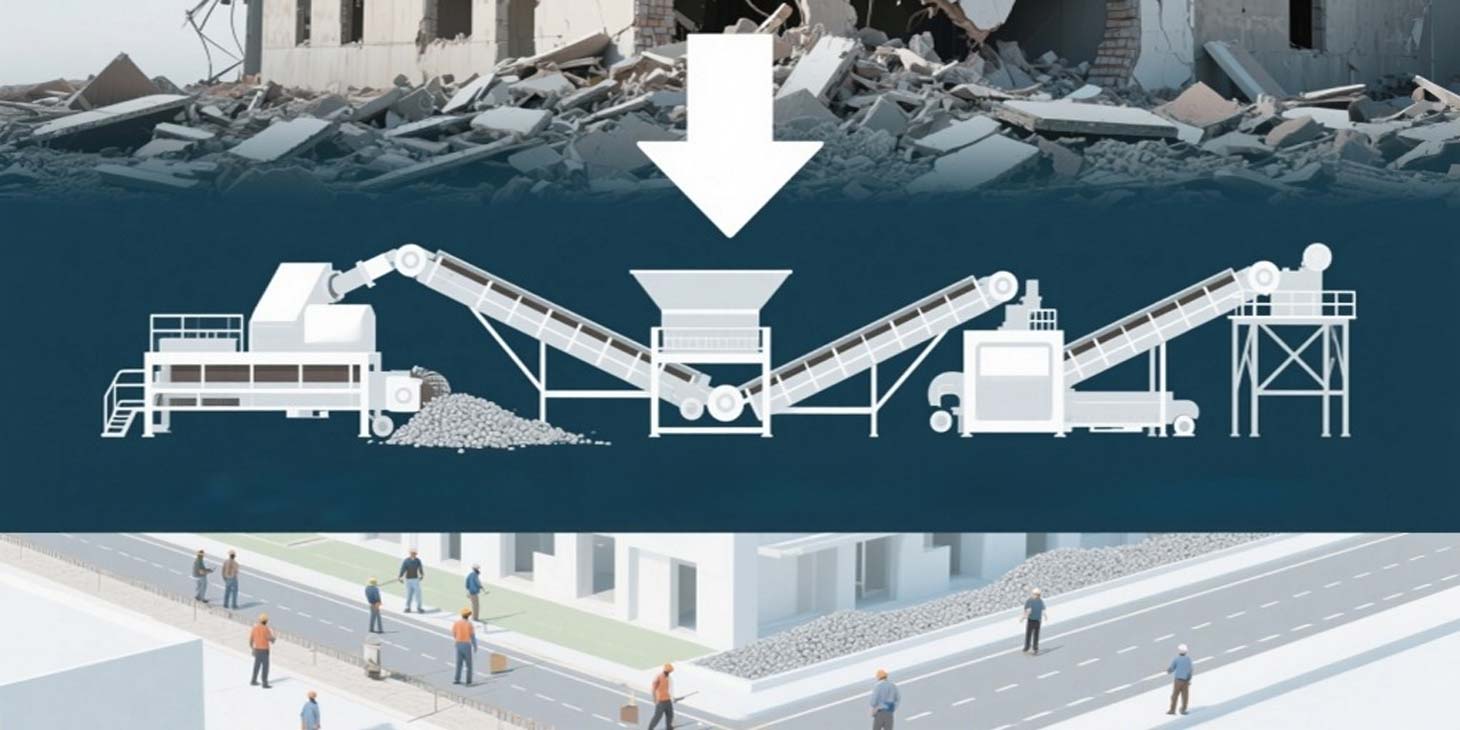
- Construction Waste Recycling: Mobile crushing equipment has reduced investment payback periods to just 3 years. China’s “Zero-Waste City” initiatives are driving surging demand for recycled aggregates (expected to reach 35% of total by 2030).
- Industrial By-Product Substitution:
Steel Slag Sand: Can replace up to 20% of natural sand, improving compressive strength by 15% (China consumes over 500 million tons annually).
Fly Ash Aggregates: China processes over 1 billion tons annually, significantly reducing land occupation from coal gangue stockpiles.
Ecological Restoration Technologies for Quarries
- Slope Revegetation: China Gezhouba Group employs “topsoil spraying + microbial inoculants,” raising revegetation rates from 30% to 80%.
- Tailings Utilization: The tailings-to-sand utilization rate has increased from 30% to 60%, with China processing over 2 billion tons of tailings per year.
- Innovation Focus: Production of glass-ceramics from tailings, increasing product value by up to 300%.
Integration of Renewable Energy
- Photovoltaic-Powered Mines: In China’s Qinghai province, 80% of mining areas are equipped with photovoltaic systems, supplying 30% of annual electricity demand.
- Hydrogen-Powered Equipment: Hydrogen fuel cell mining trucks offer 50% longer range; the EU plans to deploy 5,000 units under pilot programs by 2030.
Bio-Based Sand Stabilization Technologies
- Microbial Sand Stabilization: Cyanobacteria are used to bind sand particles, increasing wind erosion resistance by 50%; pilot projects in Dubai have reduced costs by 70%.
- Plant Fiber-Reinforced Aggregates: Straw fiber admixtures enhance concrete crack resistance by 40%. The solution shows strong potential in India’s rural markets, offering costs 20% lower than traditional sand.
2.3 Technology Suppliers and R&D Trends
Strategic Moves of Leading Enterprises
| Company | Core Strategy Focus | Key Markets | Representative Projects |
|---|---|---|---|
| Lafarge Holcim | – Green cement & recycled aggregates- M&A in developing markets (Africa, Southeast Asia) | Europe, Africa, India | Mombasa Port Aggregates Project in Kenya (aligned with Chinese infrastructure contractors) |
| Heidelberg Cement | – Carbon capture technologies (CCUS)- Green mine certification in Europe | Germany, USA, Middle East | Fly Ash Aggregate Plant in Poland (EU subsidies cover 25% of CAPEX) |
| USG Corporation (USA) | – High-purity specialty sands (quartz sand)- Development of frac sand for shale gas | USA, Canada, Mexico | Shale Sand Mine in Texas (annual capacity of 10 million tons) |
| KHD Group (Germany) | – Export of intelligent crushing equipment- Development of uranium-associated sands | Central Asia, Eastern Europe | Uranium Sand Project in Kazakhstan (partnered with CGN Resources) |
R&D Priorities: Greener, Smarter, and More Specialized

Low carbon production process
| Technology Focus | Key R&D Objective | Case Example | Economic Benefit |
|---|---|---|---|
| Low-temperature calcined sand | Lower calcining temp from 1200°C to 800°C, reduce energy use by 40% | Chinese Academy of Sciences (25% price premium in North America) | Payback in 3–4 years, CO₂ emissions reduced by 1.5 tons per ton |
| Waterless sand washing | Dry screening + electrostatic dust removal, 70% water saving | NEOM project in Saudi Arabia (25% cost reduction) | Wastewater treatment cost cut by $30/ton |
| Carbon capture (CCUS) | CO₂ captured during calcination of calcium carbonate, stored or reused | Krafla Cement Plant, Norway (abatement cost < €20/ton) | Eligible for EU carbon border tax exemption |
Industrial Waste Utilization
| Technology Focus | Key R&D Objective | Case Example | Policy Support |
|---|---|---|---|
| Steel slag sand purification | Magnetic & flotation separation to achieve SiO₂ ≥ 95% | Baowu Group, China (5 million tons/year) | 30% CAPEX subsidy by MIIT, China |
| Fly ash aggregates | ≥30% fly ash content, ≥30 MPa compressive strength | HeidelbergCement, Poland (EU certified) | Bonus under EU green building standards |
| Tailings-to-sand | Increase tailings utilization from 30% to 60% | Conch Cement, China (2 billion tons/year) | 20% resource tax reduction |
Smart Mining
| Technology Focus | Key R&D Objective | Case Example | Efficiency Gains |
|---|---|---|---|
| Autonomous haul trucks | 5G + high-precision positioning, 40% higher transport efficiency | FMG, USA (60% labor cost reduction) | 80% drop in accident rates |
| AI-based ore blending | Real-time optimization, 10% higher material utilization | Conch Cement, China (25% energy savings) | 500,000 tons less ore wasted/year |
| Intelligent drilling systems | Geological modeling + automated drilling, <1% error rate | Anglo American, South Africa (30% lower exploration costs) | Mining cycle shortened by 6 months |
Digital Supply Chain
| Technology Focus | Key R&D Objective | Case Example | Cost Savings |
|---|---|---|---|
| Blockchain traceability | End-to-end tracking of aggregate origin, 100% authenticity | EU CE certification project (15% premium potential) | 70% reduction in quality disputes |
| IoT-based monitoring | Real-time equipment status, ≥90% fault prediction accuracy | CNBM Smart Mines, China (20% lower maintenance costs) | Equipment downtime halved |
| Intelligent drilling systems | Geological modeling + automated drilling, <1% error rate | Anglo American, South Africa (30% lower exploration costs) | Mining cycle shortened by 6 months |
Semiconductor-Grade Quartz Sand
| Technology Focus | Key R&D Objective | Case Example | Market Premium |
|---|---|---|---|
| Flotation purification | SiO₂ purity ≥ 99.9%, impurities < 0.01% | Mozambique mines (technology monopolized by Japan’s Tosoh) | Price is 3× that of standard sand |
| Electrodialysis desalination | Desalination cost < $0.50/ton | NEOM project, Saudi Arabia (for Middle East infrastructure) | Eligible for EU REACH exemption |
3D Printing Sand
| Technology Focus | Key R&D Objective | Case Example | Technical Barrier |
|---|---|---|---|
| Silica sand particle size control | Particle size ≤ 0.15 mm, flowability ≥ 95% | BASF, Germany (30% YoY export growth) | Particle size deviation ≤ ±5% |
| Binder adaptation | Low-temp curing resin (≤80°C curing temp) | Chinese Academy of Sciences (cuts 3D printing cost by 40%) | Compressive strength ≥ 20 MPa |
3. Competitive Landscape and Industry Chain Overview
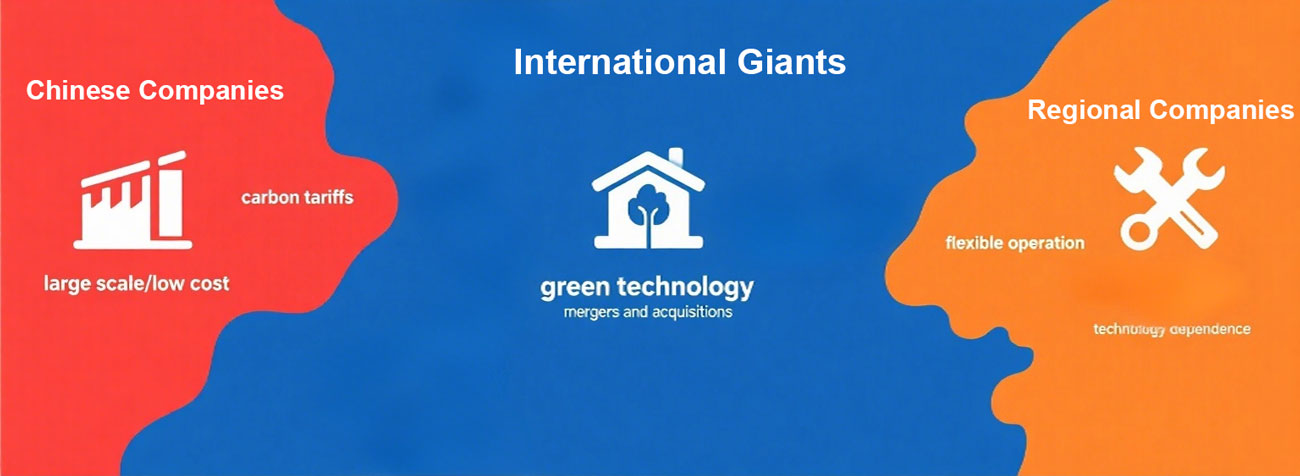
The competitive landscape of the global aggregates industry is defined by regional fragmentation, technological stratification, and resource dominance:
- Chinese enterprises dominate the Asia-Pacific market with scale and cost advantages, yet face significant barriers in the EU due to carbon tariffs and technical standards.
- Multinational giants strengthen their hold on premium markets (Europe and North America) through green technologies and regional acquisitions.
- Regional players compete on agility in fragmented markets across Southeast Asia and Africa, though remain heavily dependent on external technologies.
The defining factors for future leadership in the industry will be:
- the ability to break through environmental constraints at lower cost (e.g., through recycled aggregates and hydrogen-powered equipment);
- the successful replication of the “resources + infrastructure” model in Africa.
3.1 Key Competitor Analysis
Leading Enterprises
Global Giants
- Lafarge Holcim: The world’s largest aggregates producer (over 300 million tons in 2023) and the second-largest cement manufacturer. Its aggregates business focuses on Europe—where recycled aggregates account for 40% of supply—and Africa, notably the Mombasa Port project in Kenya.
- Heidelberg Cement: A German leader in carbon capture technology. Its fly ash aggregate plant in Poland has received EU subsidies. As of 2023, recycled materials made up 28% of its product mix, and its carbon reduction roadmap is considered industry-leading.
Regional Leaders
- China National Building Material Group (CNBM): The world’s largest producer of aggregates, with over 1 billion tons/year capacity in China. International operations include a 5-million-ton mine in Ethiopia and participation in Indonesia’s new capital city development.
- Conch Cement: Operates 300 million tons/year of manufactured sand capacity in China. Commands over 40% market share in the Southeast Asian manufactured sand sector.
- USG Corporation (USA): Specializes in frac sand derived from shale gas fields, with a Texas facility producing 10 million tons annually. Currently piloting hydrogen-powered crushing equipment.
- Columbia Steel (Canada): A pioneer in recycled aggregates, with 70% of its capacity dedicated to recycled materials. Closely aligned with U.S. infrastructure funding via the IIJA (Infrastructure Investment and Jobs Act).
- VinFast (Vietnam): A leading domestic manufacturer of mobile crushing stations, holding over 50% market share. Known for catering to the fragmented mine landscape in the region.
- Power China (representing Chinese firms): Controls over 60% of the aggregate supply for Indonesia’s new capital city project, illustrating strong execution in overseas infrastructure integration.
- CNBM (Ethiopia): The largest aggregates supplier in East Africa, with over 50% regional capacity share.
- Suez Cement (Egypt): A dominant local player involved in Egypt’s new capital project, in partnership with CNBM. Domestic production currently meets only 30% of demand.
- Rosaggregat (Russia): A major subsidiary of the Federal Mining Group, commanding over 40% of the domestic aggregates market.
- Kazakhmys (Kazakhstan): The largest manufactured sand producer in Central Asia, and a key collaborator in China’s Belt and Road Initiative.
Emerging Forces in the Aggregates Industry
A new wave of innovative players is reshaping the global aggregates landscape through technological breakthroughs, vertical integration, and sustainability-driven transformation:
- JFE Steel (Germany): Pioneering steel slag sand purification technology with a recovery rate exceeding 90%, enhancing circular utilization of industrial byproducts.
- BASF (Germany): Developed precision particle-size control technology for silica sand, achieving a margin of error within ±5%, supporting high-performance applications in construction and glass manufacturing.
- Sandvik (Sweden): Introduced hydrogen fuel cell-powered mining trucks, enabling up to 40% reduction in carbon emissions during aggregate transport and extraction.
- Adani Group (India): Rapidly expanded through the acquisition of five regional mining companies, reaching over 800 million tons of annual capacity in 2023, ranking third globally. Its vertical integration of power generation and port logistics has cut transportation costs by 30%.
- Zoomlion (China): The global leader in manufactured sand equipment with a 35% market share. Introduced nano-modification technology that boosts concrete strength by 15%. Also collaborates with academic institutions to develop intelligent screening systems, achieving 20% energy savings.
- Vale (Brazil): Leveraging its iron ore reserves to expand manufactured sand exports, with annual growth of 12%, targeting the high-end building materials segment in North America. Environmental policies tied to rainforest conservation are driving its investment in “zero-deforestation certified” mining operations.
- Saudi Sand (Middle East): Developing desert sand modification technologies to reduce import dependency, backed by Saudi Arabia’s Vision 2030 industrial diversification strategy.
- Urban Mining Corp (Netherlands): Applies AI-driven sorting technologies to convert urban waste into sand-grade aggregates. Production capacity doubled in 2023, driven by EU circular economy incentives.
- AquaMetals (USA): Utilizes electrochemical processes to recover metals from construction debris while producing recycled aggregates. Backed by investment from the Bill & Melinda Gates Foundation, highlighting its innovation in green urban mining.
Collaboration Models
Collaboration in the global aggregates industry is increasingly characterized by resource integration, technological complementarity, and policy alignment, forming a diversified cooperative ecosystem. Five dominant models are emerging:
1. Upstream–Downstream Industrial Collaboration
2. Cross-Regional Joint Ventures
3. Technology Alliances and R&D Partnerships
- LafargeHolcim + Trimble: Co-developed a digital mine modeling system that increased production efficiency by 18%.
- KraussMaffei (Germany) + BASF: Jointly launched low-cement ratio aggregates, reducing carbon emissions by 25%.
- BASF (Germany) + Chinese Academy of Sciences: Collaborating on the purification of specialty sand for 3D printing applications.
- Conch Cement + China Resources Cement: Built a shared regional supply chain across Southeast Asia, optimizing logistics and mineral resource utilization.
- Vicat (Africa) + Engie (France): Partnered to develop solar-powered mining operations.
- Vale (Brazil) + CEMEX: Established an integrated “mine-to-aggregate-to-concrete” hub, cutting logistics costs by 30%.
4. Public–Private Partnerships (PPP/PFI)
- CNBM + Saudi Arabia’s Public Investment Fund (PIF): Supplying aggregates for Saudi Arabia’s NEOM smart city project.
- Indonesian Government + Komatsu (Japan): Collaborating on digital upgrades for sand dredging vessels in Borneo to curb illegal mining.
5. International M&A and Resource Integration
- Acquirer: LafargeHolcim (France)
- Target: Mombasa Port Sand Mine (Kenya):The acquisition enabled rapid access to strategic resources and local market share.
3.2 Value Distribution Across the Industry Chain: Upstream, Midstream, Downstream
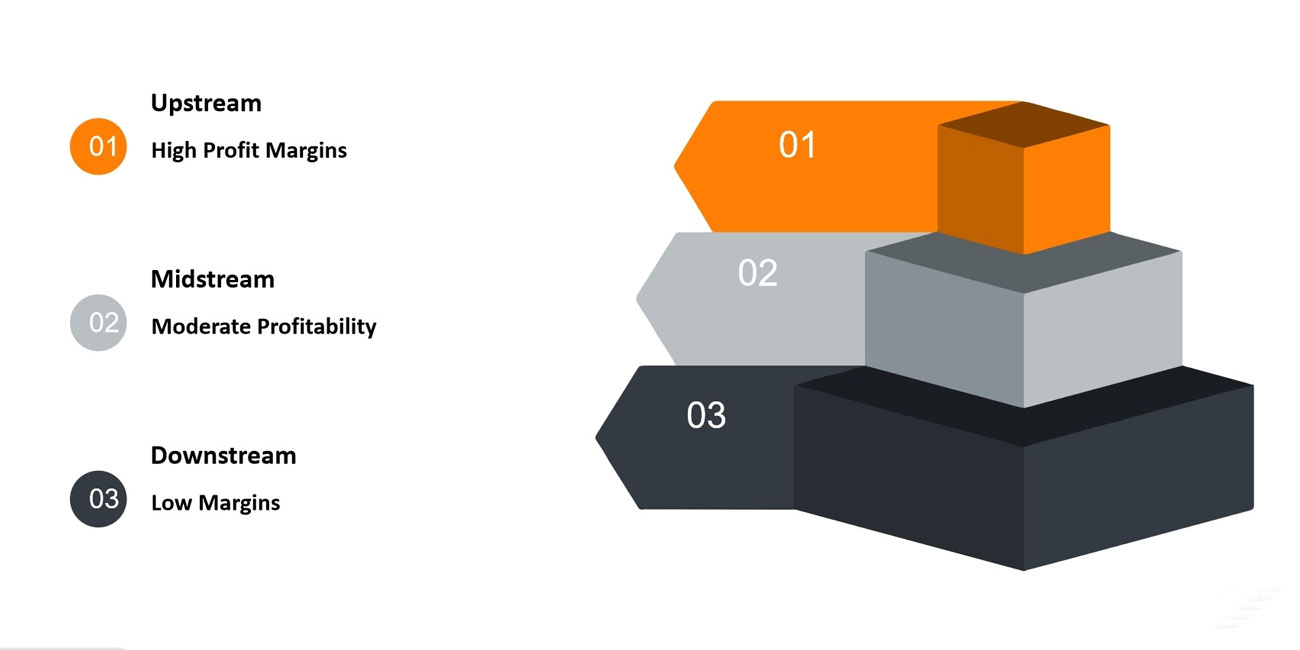
Upstream: High Profit Margins
The scarcity premium on natural sand resources is rising due to access restrictions, such as Vietnam’s export tax on marine sand and China’s ban on river sand mining.
Dependence on imported high-end equipment—such as Metso’s cone crushers—drives up technological costs and creates entry barriers.
Midstream: Moderate Profitability
In China, the market share of the top 10 aggregates producers (CR10) has increased from 35% to 50%, driven by large players leveraging smart mining technologies to reduce unit costs.
The EU’s Carbon Border Adjustment Mechanism (CBAM) is pushing midstream producers to invest in recycled aggregate production lines, with a typical return-on-investment period of 3 to 5 years.
Downstream: Low Margins
In construction, aggregates typically account for only 3%–5% of total project costs, leaving downstream firms with limited leverage in pricing negotiations.
Emerging applications—such as semiconductor packaging—are experiencing rapid growth in demand. However, due to high technical thresholds, only a few leading firms are positioned to capture significant value.
4. Policies and Regulations
The policy framework of the sand and aggregate industry is transforming from “extensive supervision” to “full life cycle governance”, with environmental protection constraints, resource sovereignty and carbon neutrality goals becoming the core driving forces.
4.1 Industry-related Policies and Regulations
| Region | Key Policy Directions | Notable Examples |
|---|---|---|
| Asia-Pacific | China: The 14th Five-Year Plan restricts natural sand extraction, promoting manufactured sand (M-sand) to achieve an 80% substitution target by 2025. | China has shut down over 1,000 illegal sand mining sites along the Yangtze River. |
| India: The National Infrastructure Pipeline (NIP) integrates mineral rights auctions to support infrastructure development. | India has seen a 25% increase in M-sand production capacity in 2023. | |
| North America | USA: The Infrastructure Investment and Jobs Act (IIJA) prioritizes the use of domestically produced aggregates. | Texas’s solar-powered mining projects benefit from tax incentives. |
| Canada: Federal projects mandate a minimum of 10% recycled aggregate usage. | Ontario reports a 35% utilization rate of recycled aggregates in construction. | |
| Europe | EU: The Carbon Border Adjustment Mechanism (CBAM) imposes tariffs on high-carbon imports, including aggregates. | Heidelberg Materials has developed low-carbon aggregate technologies in response to CBAM. |
| Germany: New buildings are required to incorporate over 30% recycled materials by 2030. | Eastern European companies are upgrading equipment to meet EU standards. | |
| Africa & Middle East | Egypt: New urban projects mandate the use of locally sourced aggregates, with import taxes increased to 20%. | Egypt has implemented tariffs to protect domestic aggregate industries. |
| Saudi Arabia: The NEOM project requires 100% renewable energy usage in aggregate production. | Saudi Aramco is investing in zero-carbon mining operations. | |
| Latin America | Brazil: The Growth Acceleration Program (PAC) supports local aggregate supply chains. | Brazil’s M-sand exports have grown by 12% annually. |
| Mexico: Extraction restrictions have led to price volatility and underutilization of small-scale operations. | Mexico City’s metro project faced delays due to aggregate supply shortages. |
4.2 Environmental Regulations
Carbon Emission Constraints
- EU Carbon Border Adjustment Mechanism (CBAM): Starting in 2026, the EU will impose carbon tariffs on imported aggregates under the CBAM framework. The levy is set at €80 per tonne of CO₂ equivalent, potentially increasing the cost of exports from countries like China and India by up to 15% (European Parliament, 2023). France and Germany will mandate that aggregates used in public infrastructure projects must meet a maximum carbon footprint of 200 kg CO₂ per tonne, effective from 2025.
- China’s Dual Carbon Goals: The sand and aggregate industry will be included in China’s national carbon emissions trading scheme, with pilot implementation beginning in 2025. A preliminary emissions cap has been set at 1.8 kg CO₂ per tonne of aggregate, according to a draft issued by the Ministry of Ecology and Environment.
Ecological Protection and Restoration
Biodiversity Offsets:
- Australia: Under the Environment Restoration Act (2023), aggregate companies must rehabilitate 1.5 times the area of natural reserves affected by their operations.
- South Africa: An “ecological banking” system allows companies to purchase credits for third-party restoration projects, effective from 2024.
Post-Extraction Rehabilitation Bonds:
-
Canada (Ontario): Companies are required to deposit CAD 50 per tonne of extracted material into a rehabilitation fund, with 80% refundable upon meeting restoration standards.
Pollution Control Measures
Air and Noise Pollution:
- WHO Guidelines: Mandate a maximum PM2.5 concentration of 25 μg/m³ in mining areas, enforceable from 2024.
- Japan’s Noise Control Law: Limits daytime noise levels near mining sites to 55 decibels, with penalties of up to USD 10,000 per day for violations.
Water Pollution:
- USA (EPA Clean Water Act Amendment 2023): Sets a maximum suspended solids concentration of 50 mg/L in wastewater from river sand mining, with non-compliant operations subject to shutdowns.
4.3 Industry Standards and Certification
International Standard Framework
| Standard Type | Core Content | Applicable Regions |
|---|---|---|
| Quality Standards | – EU EN 12620: Specifies aggregate grading, crushing value, clay content, etc. | Mandatory for construction projects in Europe and North America |
| – ASTM C33 (USA): Detailed specifications for sand and aggregate in concrete use | ||
| Environmental Labels | – EU Ecolabel: Requires full lifecycle environmental impact assessment for quarries | A prerequisite for green building project tenders |
| – LEED Certification: Awards credits for using recycled aggregates | ||
| Sustainability Certification | – ISO 14001: Environmental management system adopted by over 60% of major producers | Required for entry into global supply chains |
| – Global Reporting Initiative (GRI): Requires disclosure of carbon emissions and resource consumption data |
Regional Standard Disparities and Convergence
- Asia-Pacific Region: China’s Sand for Construction standard (GB/T 14684) strictly differentiates between natural and manufactured sand. ASEAN countries are promoting the ASEAN Green Building Material Standard to encourage mutual recognition across the region.
- Africa Region: South Africa’s SABS standard mandates a minimum compressive strength of 40 MPa for aggregates, yet less than 50% of domestic producers currently comply.
Through the Africa Sustainable Mining Initiative (ASM), the European Union is exporting environmental standards to the continent.
5. Industry Opportunities and Challenges
The global aggregates industry is navigating a critical juncture defined by the tension between growing incremental demand and mounting stock-based constraints. The interplay of emerging market dividends and the carbon neutrality transition compels enterprises to reconfigure competitiveness in a state of dynamic equilibrium.

5.1 Opportunities
Infrastructure Booms in Emerging Markets
Major infrastructure projects such as Vietnam’s North–South High-Speed Railway (spanning 1,545 km with aggregate demand exceeding 800 million tonnes) and the Lagos Metro expansion in Nigeria (annual consumption of 120 million tonnes) are fueling a surge in demand for manufactured sand.
Large-scale new city developments—such as Egypt’s New Administrative Capital and Saudi Arabia’s NEOM—are catalyzing a premium aggregates market. Africa’s aggregate consumption is projected to grow at an average annual rate of 8% through 2030.
Regional Trade Agreement Dividends:
The Regional Comprehensive Economic Partnership (RCEP) has reduced tariffs on aggregate trade among Southeast Asian countries to 5%, driving a 12% annual increase in exports from Vietnam and Indonesia.
The African Continental Free Trade Area (AfCFTA) is promoting regional capacity integration, raising local producers’ capacity utilization rates to 60%.
Dual Drivers: Policy and Capital
The EU Green Deal offers low-interest financing to support low-carbon mining transitions, with German companies receiving subsidies covering up to 30% of investment costs.
China’s “dual carbon” targets are accelerating the issuance of green bonds, which have grown at an average annual rate of 25%. Leading firms like Conch Cement have cut financing costs by 1.5%.
ESG-Investment Orientation:
Global ESG funds have increased their allocation to the aggregates industry from 2% in 2020 to 7% in 2023. Institutions such as Goldman Sachs and BlackRock have launched dedicated green infrastructure funds targeting the sector.
Technological Advancements Driving Efficiency Gains
Leading global producers are rolling out autonomous mining systems, reducing unit production costs by 10%–15%.
Blockchain-based traceability is reducing supply chain disputes and enhancing customer trust by up to 30%.
Commercialization of Low-Carbon Technologies:
Carbon capture, utilization, and storage (CCUS) costs have dropped below USD 50 per tonne, with the global market expected to exceed USD 8 billion by 2030.
Recycled aggregate technology has matured—under EU mandates, recycled content must account for at least 40%—driving construction waste recycling rates to over 70%.
5.2 Challenges
Resource Constraints and Geopolitical Risks
Global extractable natural sand reserves are estimated at less than 300 billion tonnes, translating to a mining horizon of under 50 years. Export restrictions in resource-rich countries such as Indonesia and Vietnam are tightening international supply.
In China, over 1,000 illegal sand mining operations along the Yangtze River have been shut down, intensifying pressure on manufactured sand adoption.
Geopolitical Tensions Disrupting Supply Chains:
The Russia–Ukraine conflict has halted Eastern European aggregate exports. Polish companies are turning to North Africa, raising logistics costs by 35%.
Export control measures in Indonesia have driven up prices across Southeast Asia, with regional capacity utilization experiencing volatility of up to 20%.
The Red Sea shipping crisis has pushed maritime freight rates for aggregates between the Middle East and Europe up by 40%, delaying delivery times by 2–3 weeks (Maersk, 2024).
Rising Costs of Environmental Compliance
The EU Carbon Border Adjustment Mechanism (CBAM) imposes a levy of EUR 60 per tonne on high-carbon aggregates, increasing production costs in Eastern Europe by 18%.
In China, the environmental tax regime differentiates based on dust and noise levels, with fines accounting for as much as 15% of small and medium-sized mining enterprises’ profits.
Circular Economy Mandates:
The EU Circular Economy Action Plan mandates that recycled aggregates comprise at least 40% of usage by 2030, requiring capital expenditures exceeding tens of millions of euros for equipment upgrades.
In Canada, new building projects must use no less than 20% recycled aggregates, but domestic producers face technology adaptation cycles of up to three years.
Intensifying Industry Competition
Rising Market Concentration:
The global CR10 (top 10 concentration ratio) has reached 35%, with conglomerates such as LafargeHolcim and Vinci expanding through acquisitions to control both resources and distribution channels.
In contrast, China’s CR10 remains at just 25%, and small- to medium-sized enterprises are rapidly exiting the market under escalating environmental compliance pressure.
Patent Barriers from Emerging Technologies:
Core patents in manufactured sand grading algorithms and recycled aggregate enhancement technologies are concentrated in the hands of German and Japanese companies. Licensing fees account for 5%–8% of producers’ profits.
Resource-based giants such as Vale in Brazil are deploying vertical integration strategies, further squeezing the market space for small and mid-sized equipment manufacturers.
5.3 Response Strategies
Technological Innovation: Shifting from Cost Competition to Value Creation
Accelerate the deployment of unmanned mines and AI-based scheduling systems, reducing unit production costs by an additional 10%.
Develop bio-based solidifying agents (e.g., mycelium composite materials), cutting costs by 18% compared to conventional processes.
Collaborative R&D Among Industry, Academia, and Research Institutes:
Establish joint laboratories with universities (e.g., the China National Building Material–Tsinghua University Green Building Materials Lab), aiming to secure 200 patents within three years.
Jointly develop fine sand recovery technologies through academia-industry partnerships, increasing wastewater recycling rates to 95%.
Regional Cooperation: Resource Complementarity and Risk Mitigation
Cross-Border Resource Integration:
Chinese enterprises are investing in production facilities in Africa (e.g., a manufactured sand project supporting a Guinea iron ore mine) to bypass trade barriers.
European companies engage in joint procurement of aggregates from North Africa, leveraging economies of scale to reduce logistics costs by 20%.
Standards Harmonization and Alliance Building:
Promote global adoption of ISO Guidelines for Sustainable Aggregate Production to reduce certification barriers.
Establish the Global Green Aggregates Alliance to enable shared access to carbon capture technology patent pools.
Business Model Transformation: From Single-Product Supply to Integrated Services
Strategic Client Lock-in:
Enter long-term contracts with major construction players (e.g., Vinci Group’s Paris Metro project), securing orders for the next five years.
Offer integrated “aggregates + technology + finance” service packages, boosting profit margins up to 25%.
Building a Closed-Loop Circular Economy:
Develop end-to-end value chains encompassing construction waste collection, recycled aggregate processing, and product distribution, cutting raw material costs by 30%.
Explore the use of industrial by-products (e.g., steel slag aggregates) to create a second growth curve.
Appendix
1. Reference Data
| Source Name | Type | Cited Content/Example | Related Section |
|---|---|---|---|
| European Environment Agency (EEA) | Government Agency Report | Industrial Transformation 2030: EU mandates 40% recycled aggregate usage by 2030 | Part IV (Environmental Regulations) |
| International Energy Agency (IEA) | International Organization Report | Net Zero by 2050: Carbon capture cost in the cement industry projected to fall to $50/ton by 2030 | Part V (Response Strategies) |
| Global Reporting Initiative (GRI) | Standards Organization | GRI Standards require disclosure of carbon emissions and resource consumption | Part IV (Industry Standards and Certification) |
| International Organization for Standardization (ISO) | International Standards Organization | ISO 14040:2006 Life Cycle Assessment – Principles and Framework | Part IV (Industry Standards and Certification) |
| McKinsey & Company | Consulting Report | Global Mining & Metals Outlook 2023: R&D spending in the aggregates sector accounts for 3–5% of total revenue | Part II (Technology Trends) |
| China National Building Material Group (CNBM) | Corporate Annual Report | Manufactured sand production exceeded 1 billion tons in 2023, with costs 15% below industry average | Part III (Key Players Analysis) |
| HeidelbergCement AG | Corporate Case Study | Carbon emissions at Brevik carbon capture site: 0.8kg CO₂ per ton (2023 data) | Part IV (Environmental Regulations) |
| International Transport Forum (ITF) | International Think Tank | Global Trade Costs 2023: RCEP reduced aggregate tariffs in Southeast Asia to 5% | Part III (Regional Market Analysis) |
| U.S. Environmental Protection Agency (EPA) | Government Regulatory Document | Clean Air Act Amendments: PM emission limits tightened to 10 μg/m³ | Part IV (Environmental Regulations) |
| World Steel Association | Industry Association Report | Steel Statistical Yearbook 2023: Steel slag aggregates replace up to 25% of cement | Part II (Technology Trends) |
| International Labour Organization (ILO) | International Organization Report | Construction Sector Employment Trends 2023: Infrastructure employment in emerging markets rises to 65% | Part I (Market Overview) |
| International Renewable Energy Agency (IRENA) | International Energy Agency Report | Renewable Energy Statistics 2023: Aggregate demand for PV support structures growing at 18% annually | Part I (Application Scenarios) |
| United Nations Industrial Development Organization (UNIDO) | International Organization Report | Industrial Development Report 2023: Aggregate resource exploitation rate in Africa below 30% | Part V (Industry Opportunities) |
| China Communications Construction Company (CCCC) | Corporate Case Study | Aggregates for the Hong Kong-Zhuhai-Macao Bridge priced at $80/ton (2023 data) | Part II (Application Scenarios) |
| European Commission | Policy Document | Circular Economy Action Plan: 70% target for construction waste recycling by 2030 | Part IV (Environmental Regulations) |
| International Association of Cement Producers (CAC) | Industry Association Report | Global Cement Report 2023: Top 5 global aggregate firms invest 3–5% of revenue into R&D | Part II (Technology Trends) |
| World Economic Forum (WEF) | International Think Tank | The Future of Construction 2023: Payback period for intelligent mining shortened to 3 years | — |
2. Industry Terminology Explanation
2.1 Technical terms
| Term | Definition | Application Scenario |
|---|---|---|
| Manufactured Sand | Aggregates produced by mechanically crushing rock, with particle sizes ranging from 0.15 mm to 37.5 mm. Requires controlled fines content and proper gradation. | Concrete production, road base construction |
| Recycled Aggregate | Reusable aggregates derived from crushed and screened construction waste. Must meet requirements for strength and impurity levels. | Low-carbon concrete, subgrade backfill |
| Nano-Modification Technology | The enhancement of aggregate performance through the addition of nanomaterials (e.g., nano-silica), improving concrete compressive strength by 15–20%. | High-end construction, marine engineering |
2.2 Policy Terms
| Term | Definition | Typical Example |
|---|---|---|
| Carbon Border Adjustment Mechanism (CBAM) | An EU policy imposing carbon tariffs on imported high-emission products, effective from 2026. Covers sectors such as cement and steel. | Carbon tariff calculations for EU aggregate imports |
| Mandatory Recycled Material Inclusion Rate | A regulatory requirement that mandates the minimum percentage of recycled aggregates in construction projects. The EU’s 2030 target is set at 40%. | Germany’s recycled aggregate policy for new buildings |
2.3 Market Terms
| Term | Definition | Data Example |
|---|---|---|
| CR10 | Market concentration ratio of the top 10 enterprises in the industry; indicates the level of market dominance. | CR10 in China’s aggregate industry = 25% (2023) |
| ESG Investment | Investment strategy based on integrated evaluation of Environmental, Social, and Governance factors. | ESG-focused funds account for 7% of global aggregate sector investment |
