

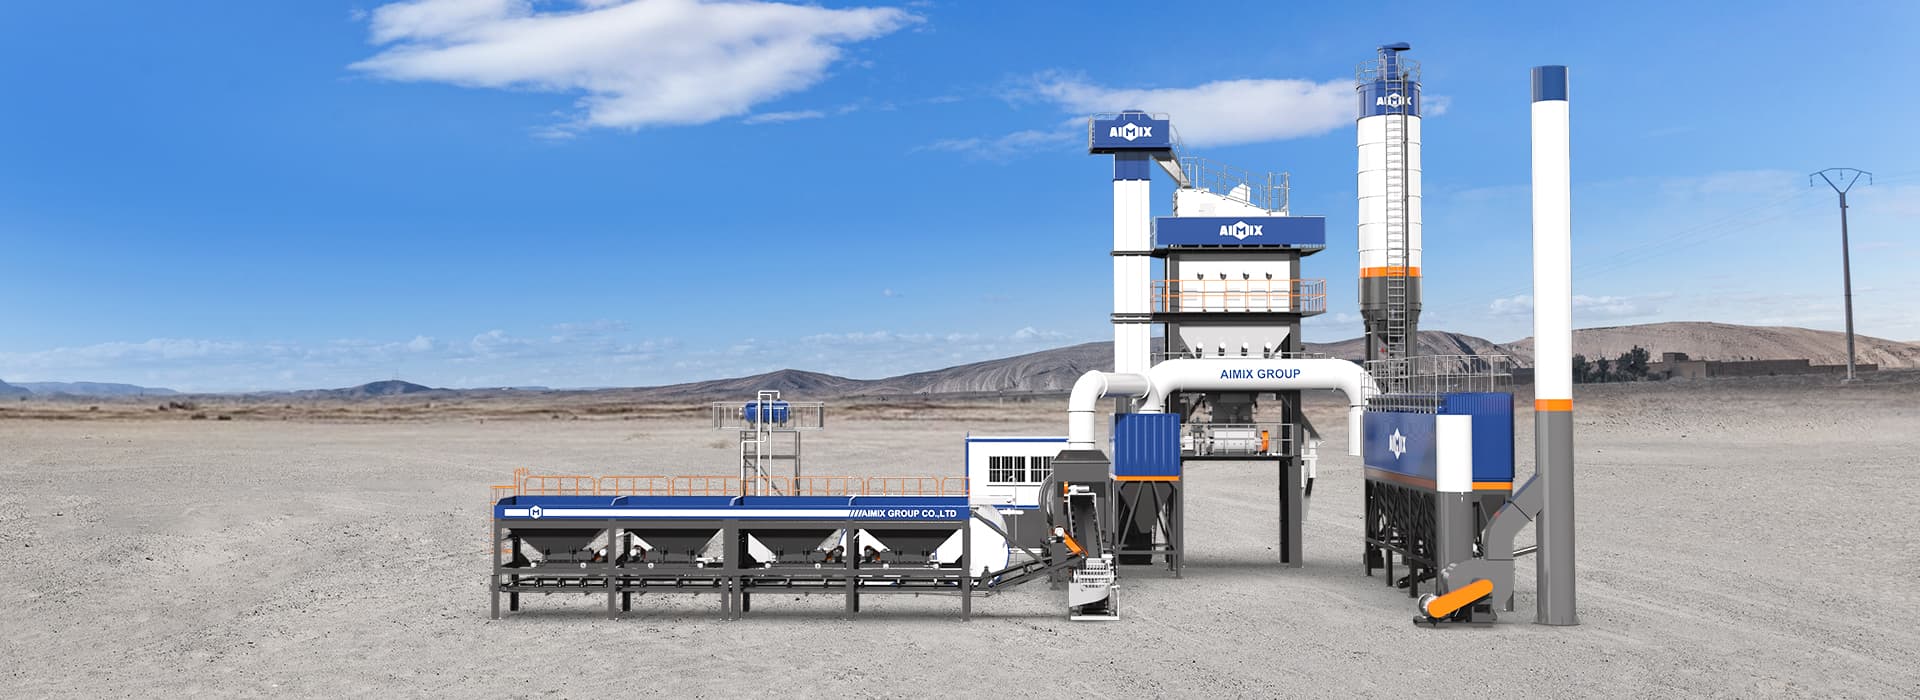
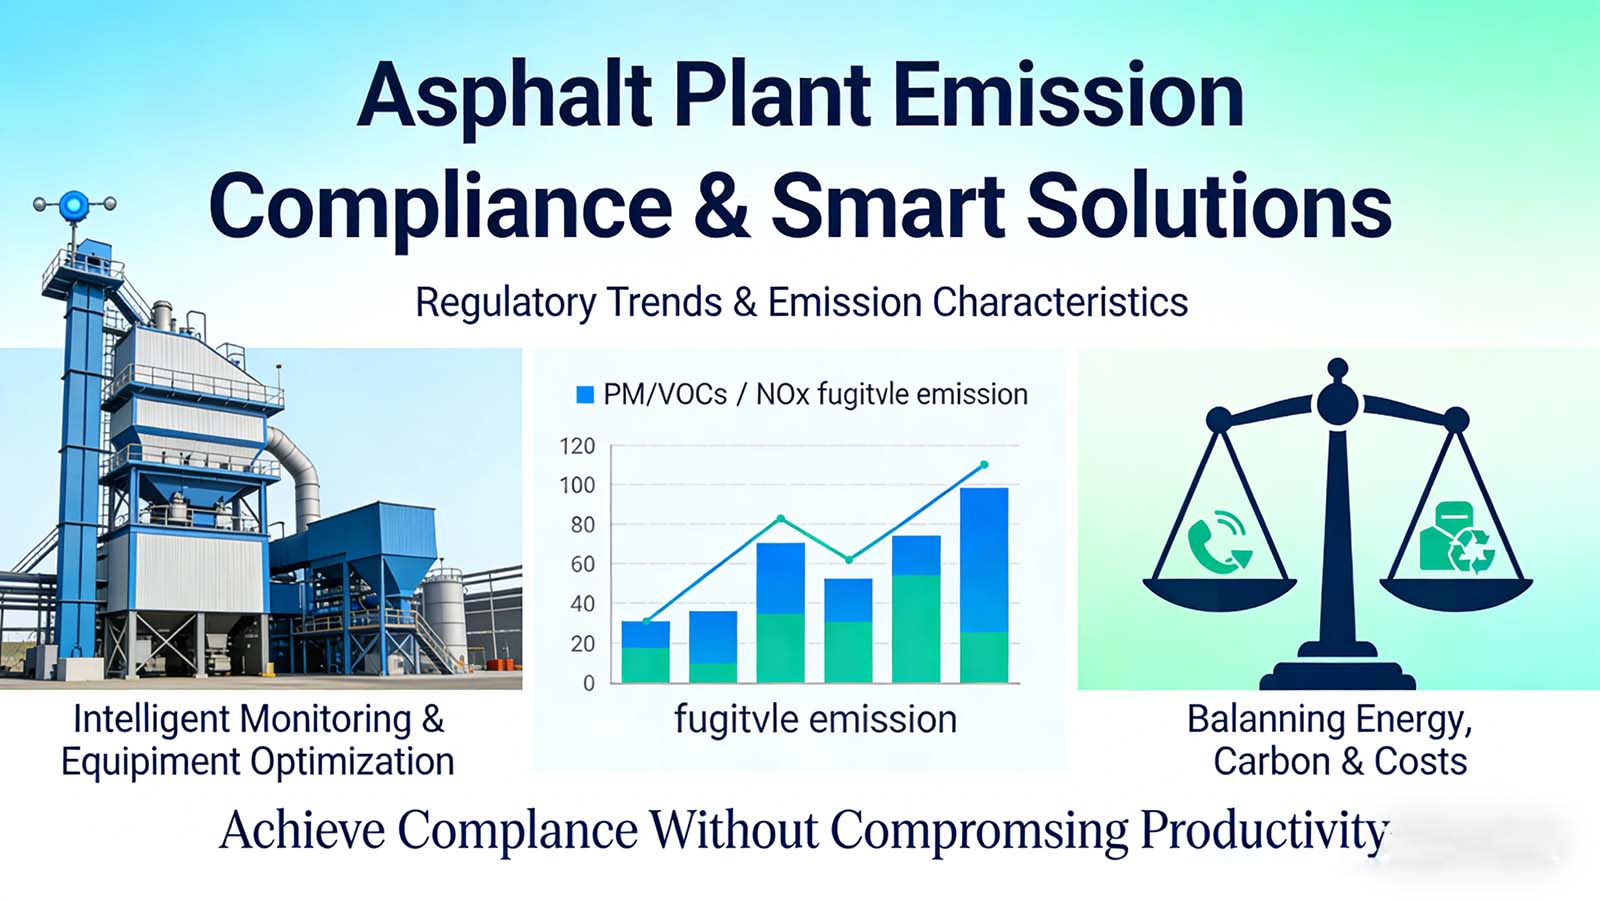
With global environmental regulations tightening, asphalt plants face growing pressure to control emissions. Pollutants like PM, VOCs, NOx, and fugitive emissions impact both local ecosystems and public health, and are tightly monitored by regulators worldwide. To stay compliant and efficient, companies must optimize equipment, processes, and adopt intelligent monitoring, balancing energy use, carbon output, and operational costs. This article explores regulatory trends, emission characteristics, and smart strategies for equipment and technology selection to achieve compliance without compromising productivity.
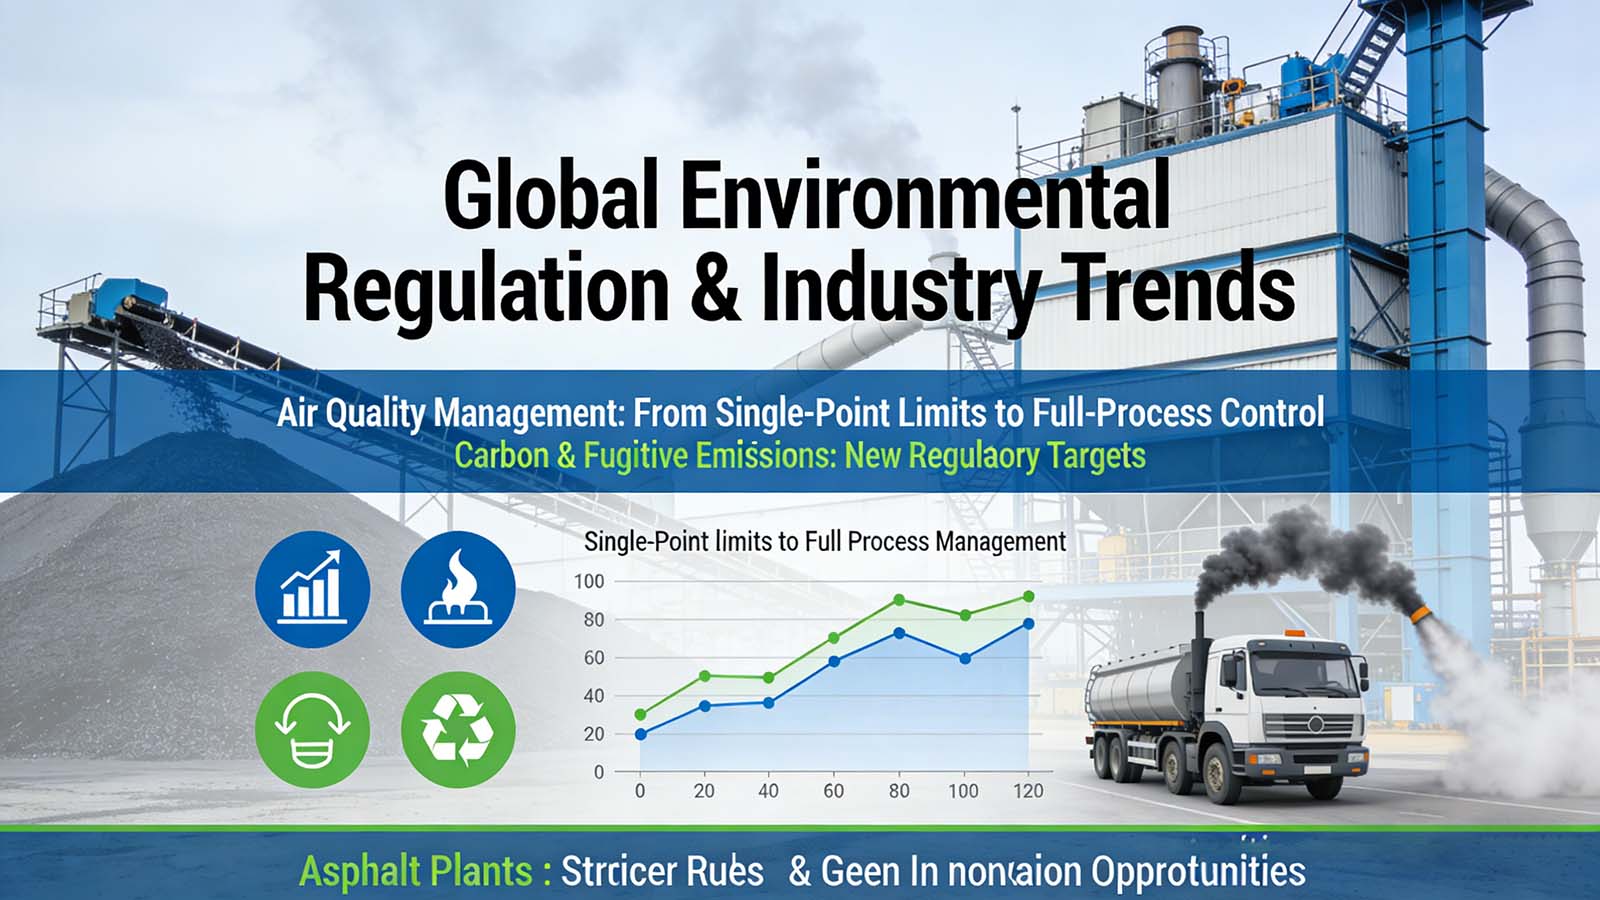
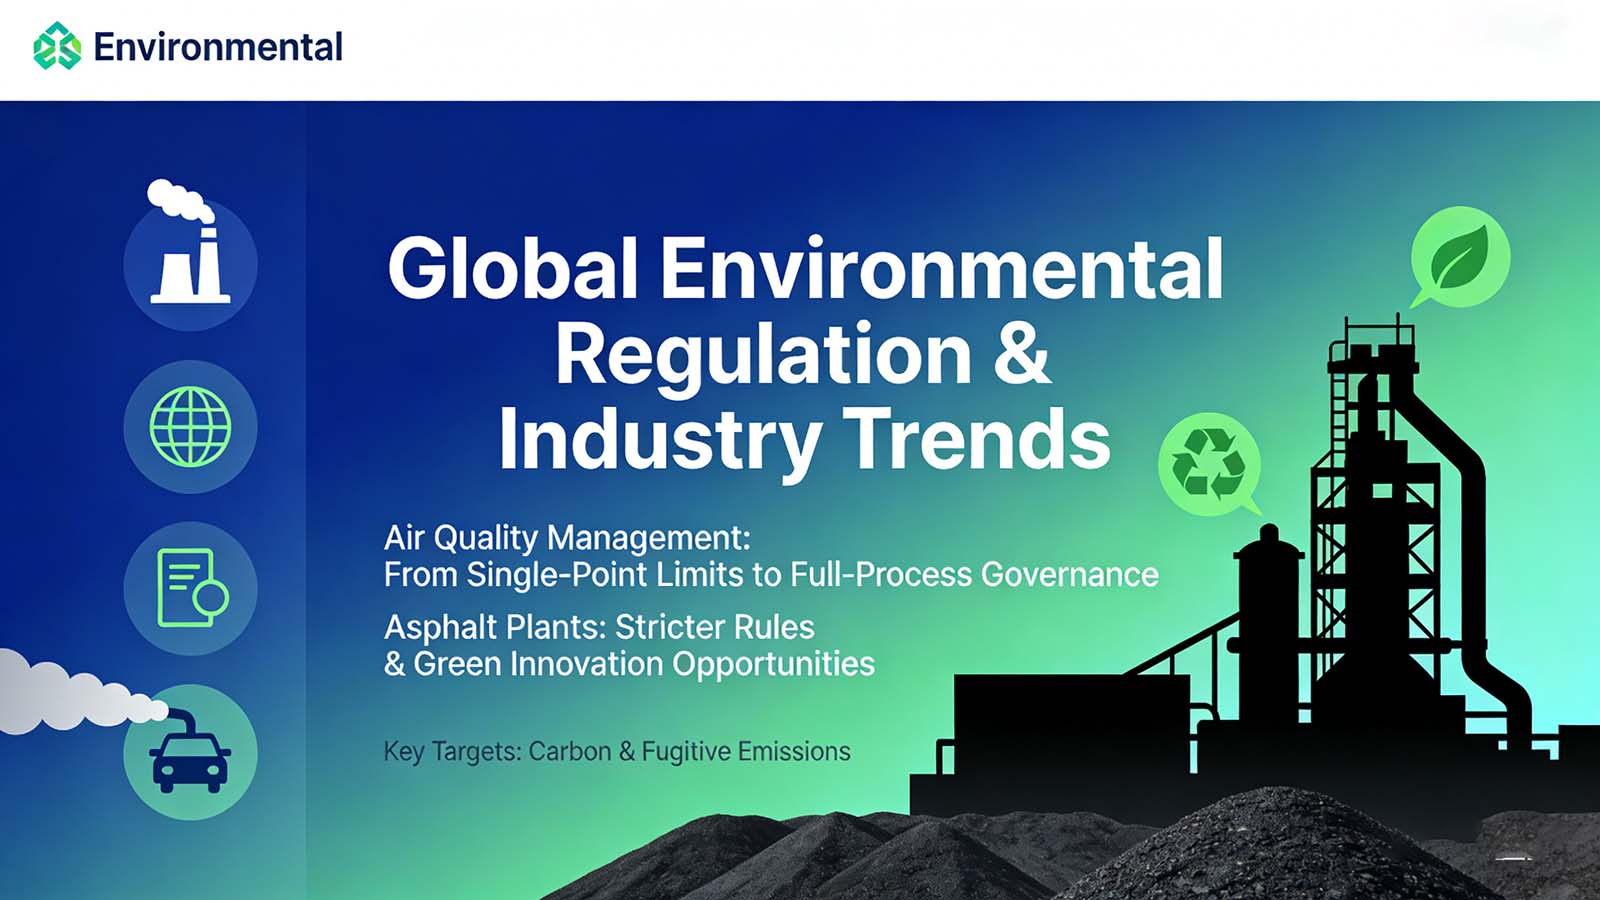
Global Environmental Regulation Background and Industry Trends
With ongoing industrialization and urbanization, air quality management has become a global policy focus. Industrial emissions, energy use, and vehicle exhaust are major pollution sources. Recently, regulations have shifted from single-point limits to full-process, multi-factor management. Carbon and fugitive emissions are now key targets, driving environmental transformation in traditional industries. In this context, asphalt plants—known for high dust and VOCs emissions—face stricter rules while gaining opportunities for green production innovation.
Global Air Quality Management Enters a Deep Control Phase
Air quality regulations are continuously tightening worldwide. Referencing the latest WHO Air Quality Guidelines, countries have updated or established national standards. Compared with previous lenient policies, the new regulatory wave emphasizes lower pollutant limits and more comprehensive legal frameworks.
The table below compares WHO guidelines with current standards in several countries/regions:
| Pollutant | WHO Latest Guideline (Annual Avg.) | US NAAQS | EU Air Quality Directive | China National Standard |
|---|---|---|---|---|
| PM₂.₅ | 5 µg/m³ | 12 µg/m³ | 25 µg/m³ | 35 µg/m³ |
| PM₁₀ | 15 µg/m³ | 50 µg/m³ | 40 µg/m³ | 70 µg/m³ |
| NO₂ | 10 µg/m³ | 53 ppb (~100 µg/m³) | 40 µg/m³ | 40 µg/m³ |
| O₃ (8h) | 100 µg/m³ | 70 ppb (~137 µg/m³) | 120 µg/m³ | 160 µg/m³ |
Notes:
- WHO standards are generally stricter and serve as long-term targets for many environmental agencies.
- National standards vary, but the overall trend is toward tighter and more convergent limits.
- For industrial facilities, this means more sources fall under regulatory scrutiny, and emission control requirements are higher.
From Concentration Limits to Full-Process Emission Management
Traditional emission regulations focused mainly on whether pollutant concentrations at chimney outlets met the limits. As environmental management concepts evolve, global regulations now emphasize full-process control. This approach requires monitoring and managing emissions throughout production, with traceable data.
The table below summarizes key differences between traditional regulation and full-process management:
| Management Aspect | Traditional Emission Control | Full-Process Emission Management |
|---|---|---|
| Core Objective | Chimney outlet limits | Full-process emission control |
| Data Requirement | Periodic on-site testing | Real-time online monitoring + data recording |
| Control Method | End-of-pipe treatment | Source reduction + process optimization + end-of-pipe treatment |
| Regulatory Tools | Spot checks | Emission permits, CEMS, third-party verification |
Trends:
- Emission permits are becoming standard worldwide; non-compliant operators may lose their licenses.
- Continuous Emission Monitoring Systems (CEMS) are now a common requirement.
- Regulators increasingly review process control capabilities, not just outlet concentrations.
Fugitive Emissions and Carbon Emissions as New Focus Areas
Under full-process management, fugitive emissions—those not released through fixed outlets—are now under strict regulation. Examples include:
Dust during raw material handling
Dust release from finished material storage
VOCs exposure during loading and transportation
Meanwhile, global climate governance has pushed carbon emissions from national targets to enterprise-level accountability. Industrial facilities now conduct energy audits, carbon footprint assessments, and implement reduction measures.
The table below summarizes current regulatory focus and control measures for three emission types:
| Emission Type | Regulatory Focus | Main Control Measures |
|---|---|---|
| Stack Emissions | Concentration & total volume | Emission permits, end-of-pipe treatment |
| Fugitive Emissions | Diffuse sources control | Enclosed silos, negative pressure collection, paved surfaces |
| Carbon Emissions | GHG accounting and reporting | Energy optimization, fuel substitution, waste heat recovery |
The Role of the Asphalt Industry in Global Green Transformation
Asphalt plants are essential for highways and urban roads, but their production involves high-temperature combustion, material drying, dust release, and VOCs emissions, making the industry a regulatory priority. Facing stricter emission standards, permits, and process monitoring requirements, the industry is undergoing a green and smart transformation:
Green Production TechnologiesWarm Mix Asphalt (WMA) reduces production temperatures to 120–140°C, cutting energy use and VOCs by 20–30% compared with traditional hot mix.
Resource RecyclingUsing high proportions of Reclaimed Asphalt Pavement (RAP) reduces reliance on virgin materials and lowers carbon footprint.
Intelligent Compliance ManagementCEMS integrated with SCADA systems ensures real-time emission monitoring and optimizes production while meeting environmental requirements.
The table below summarizes key green transformation paths and their benefits:
| Green Transformation | Implementation Measures | Environmental & Operational Benefits |
|---|---|---|
| Warm Mix Technology | Lower production temperature | 20–30% energy & VOC reduction |
| High RAP Utilization | Increase recycled asphalt content | Save resources & reduce carbon emissions |
| Intelligent Monitoring | CEMS + SCADA integration | Real-time compliance & precise operations |
| Full Plant Enclosure & Negative Pressure | Control fugitive emissions | Reduce dust & VOC leakage |
Understanding global environmental regulations helps us see the direction the industry is moving. To respond effectively, we also need to understand where emissions actually come from inside an asphalt plant. The next chapter looks at the main emission sources and how they form during production.
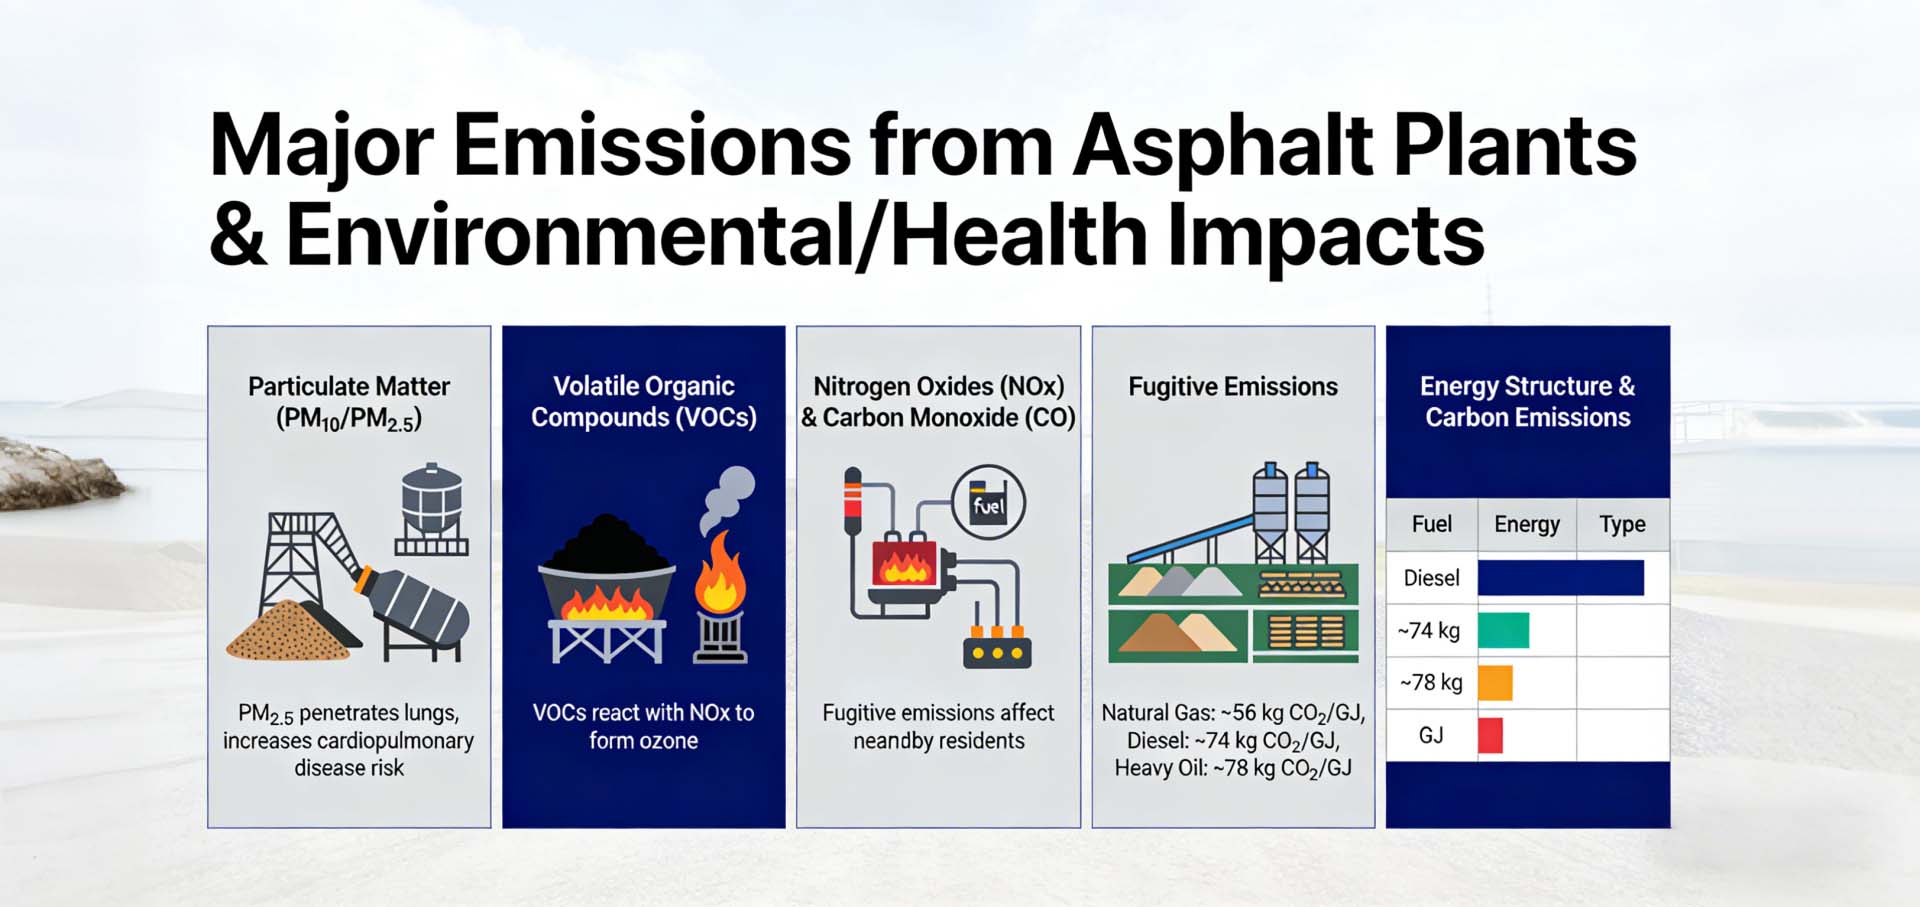
Major Emissions from Asphalt Plants and Environmental/Health Impacts
Asphalt plants generate pollutants at multiple stages, including raw material drying, fuel combustion, asphalt heating, mixing, and finished product storage. These emissions can affect both the surrounding environment and public health. This chapter focuses on the main emission sources, their potential environmental and health risks, and the energy structure and carbon emission characteristics of asphalt plants.
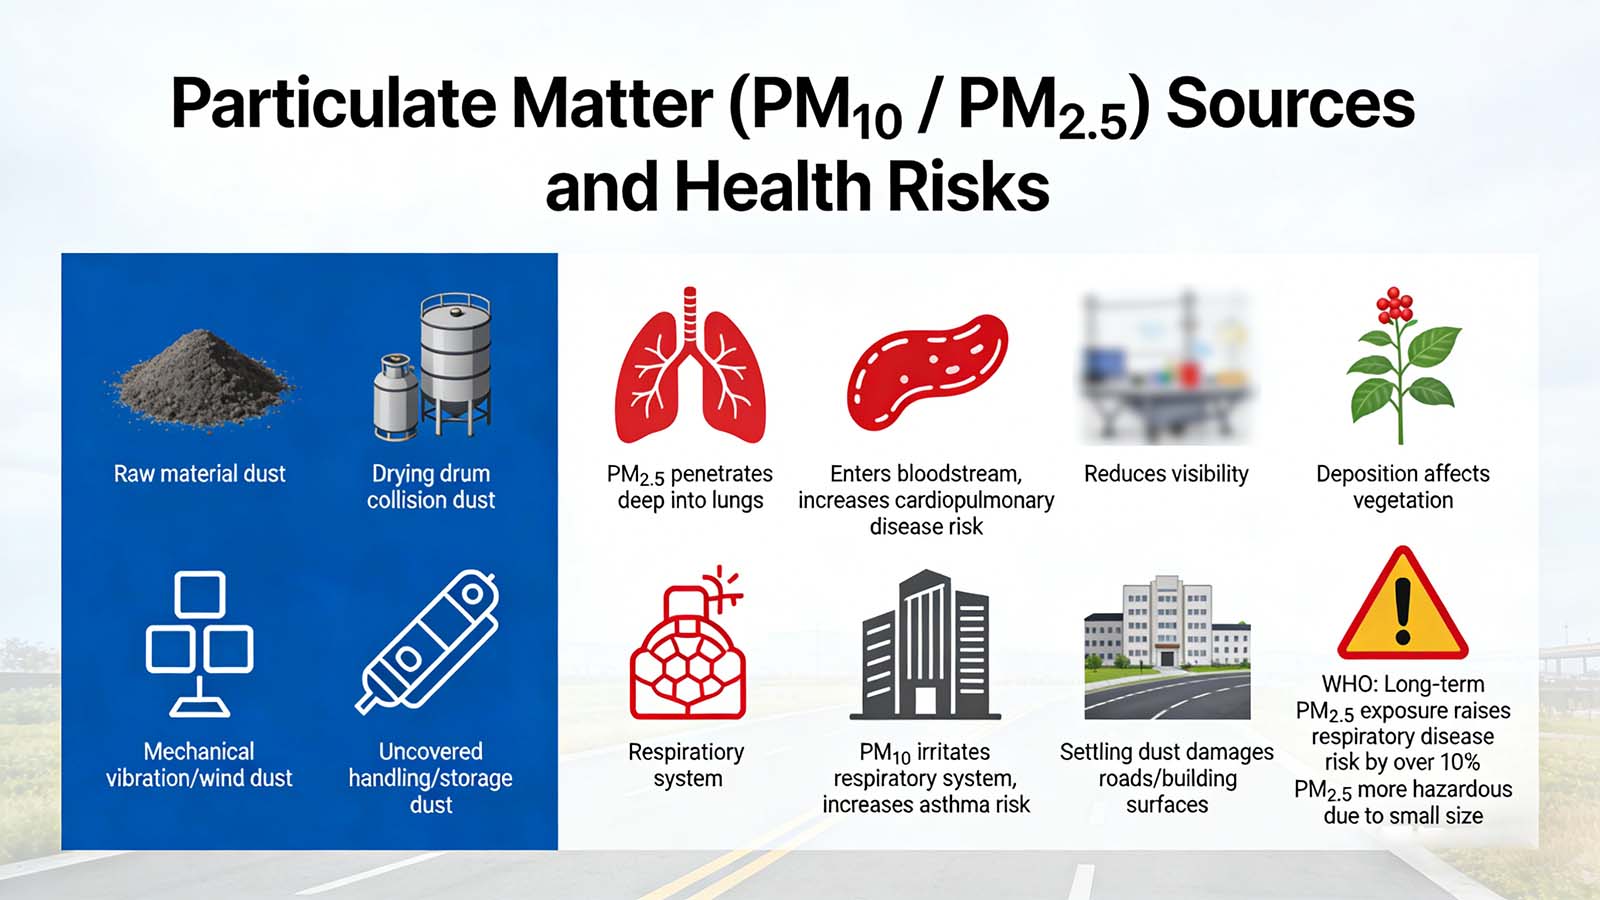
Particulate Matter (PM₁₀ / PM₂.₅) Sources and Health Risks
Particulate matter in asphalt plants mainly comes from:
Dust from raw materials (aggregates, powders) during feeding and conveying;
Dust generated by material collisions in the drying drum;
Secondary dust caused by mechanical vibration and wind during production;
Fugitive dust from uncovered handling and storage.
Health and Environmental Impacts
PM₂.₅ penetrates deep into the lungs and enters the bloodstream, increasing cardiopulmonary disease risk. It also reduces visibility and its deposition can affect vegetation.
PM₁₀ irritates the respiratory system and increases asthma risk. Settling dust can damage roads and building surfaces.
The World Health Organization estimates that long-term exposure to high PM₂.₅ levels raises respiratory disease risk by over 10% and is linked to cardiovascular disease. PM₂.₅ is more hazardous than PM₁₀ due to its smaller size, which allows deep penetration into the lungs.
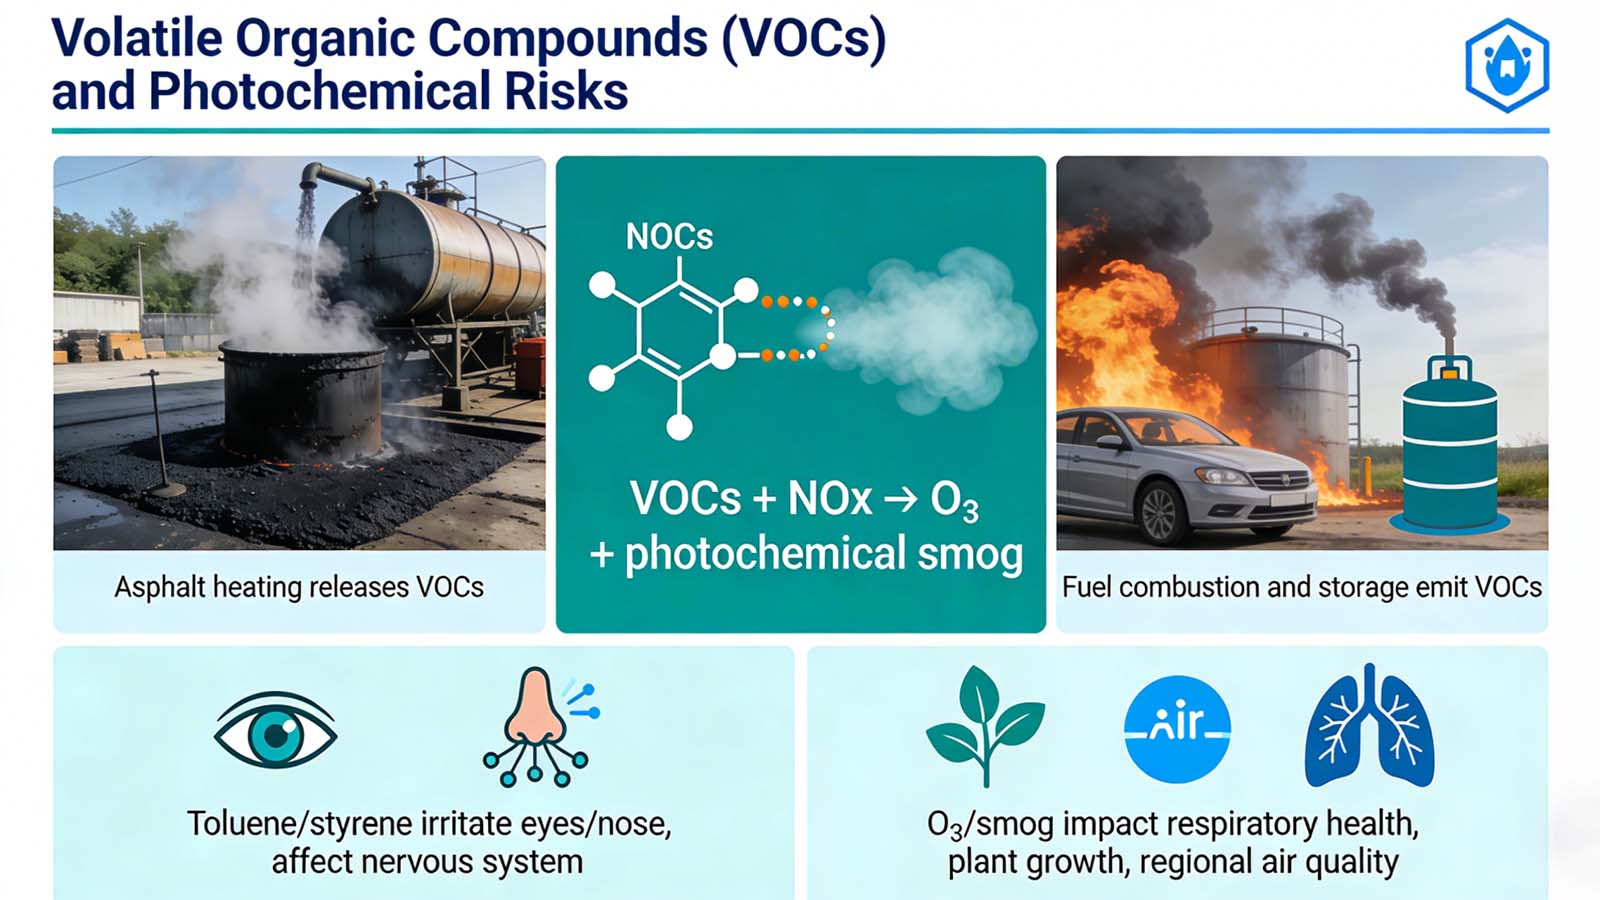
Volatile Organic Compounds (VOCs) and Photochemical Risks
Asphalt heating releases VOCs due to its complex organic composition. Fuel combustion and asphalt storage can also emit VOCs.
Health and Environmental Impacts
VOCs such as toluene and styrene from asphalt heating and fuel volatilization can irritate eyes and nose and affect the nervous system.
Other VOCs from incomplete combustion can react with nitrogen oxides (NOx) to form ozone (O₃) and photochemical smog.
Under sunlight, VOCs react with NOx to produce ozone and photochemical smog, impacting respiratory health, plant growth, and regional air quality.
Nitrogen Oxides (NOx), Carbon Monoxide (CO), and Other Combustion Emissions
Fuel combustion (diesel, heavy oil, natural gas) is used for drying aggregates and heating asphalt. Combustion generates by-products:
- NOx: Produced from high-temperature reactions of nitrogen and oxygen;
- CO: Formed during incomplete combustion;
- Other products: e.g., SO₂, depending on fuel composition.
| Pollutant | Main Source | Health Impact | Atmospheric Impact |
|---|---|---|---|
| NOx | High-temperature combustion | Respiratory irritation, worsens asthma | Contributes to photochemical smog formation |
| CO | Incomplete combustion | Reduces oxygen transport by binding to hemoglobin | Indirectly affects atmospheric chemistry |
NOx emissions not only worsen smog but also participate in secondary PM₂.₅ formation.
Fugitive Emissions and Plant Area Environmental Risks
Fugitive emissions are releases not through fixed chimneys, arising from handling, storage, and transportation. Key examples include:
- Dust from raw material yards;
- VOCs or Dust from open or uncovered finished material silos;
- Dust from roads around the plant during transport;
- Material piles or unloading points without coverage.
| Emission Source | Risk Type | Control Challenges |
|---|---|---|
| Raw material storage and yards | Dust dispersion | Insufficient wind protection and collection devices |
| Finished product silos | VOCs, dust leakage | Difficulty in implementing enclosure designs |
| Transportation | Dust dispersion | Requires covered transport and paved roads |
Fugitive emissions affect nearby residents’ health, increase road dust, and pose operational safety risks. They are a key focus in modern environmental regulations.
Energy Structure and Carbon Emission Characteristics
Asphalt plants rely on fuel combustion for heat. Fuel type affects both pollutant emissions and carbon output:
| Fuel Type | Typical Use | CO₂ Emission Intensity (kg CO₂ / GJ) |
|---|---|---|
| Natural Gas | Drying and heating | ~56 |
| Diesel | Drying and heating | ~74 |
| Heavy Oil | High-temperature combustion | ~78 |
Data based on IEA and IPCC emission factors.
Key Features and Trends
- Diesel and heavy oil provide high heat but produce more CO₂ per unit energy;
- Natural gas is cleaner with lower CO₂, but availability may be limited in some regions;
- Optimizing fuel structure and switching to cleaner options reduces carbon emissions;
- Companies are increasingly required to track carbon emissions, supporting carbon trading and low-carbon incentives.
After identifying the key emission sources, the focus shifts to solutions. Different pollutants require different control methods, and choosing the right technology is essential for stable compliance. The following chapter introduces the main environmental treatment technologies used in modern hot mix asphalt plants.
Key National and Regional Regulatory Policies and Technical Trends
Global environmental regulatory systems have evolved from single-point emission limits to modern frameworks covering full-process monitoring and multi-pollutant management. As a fixed pollution source, asphalt plants face increasingly strict requirements on emission permits, technical standards, online monitoring, and low-carbon development. This chapter analyzes the regulatory approaches of the United States, the European Union, Asian markets, and global trends, providing guidance for equipment configuration and technology selection.
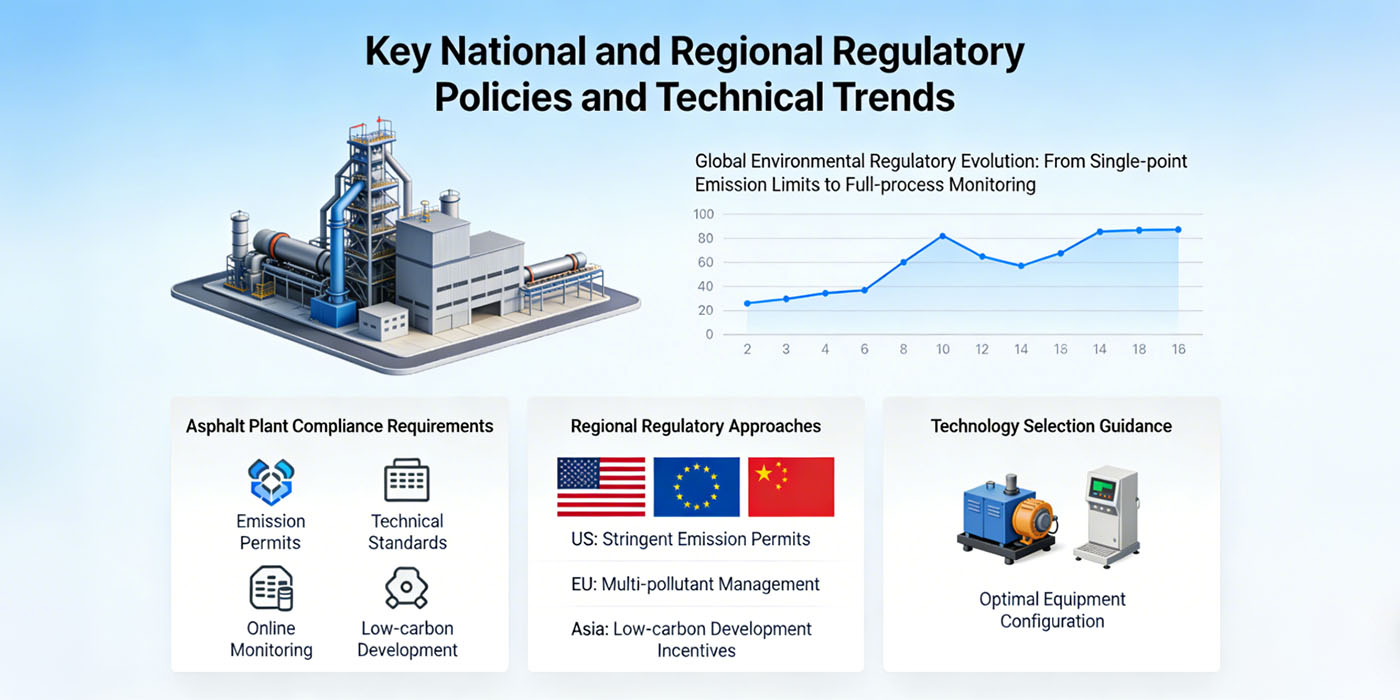
U.S. Emission Control and Best Available Technology (BAT) Requirements
The U.S. Environmental Protection Agency (EPA) sets binding standards for emissions from stationary sources through multiple regulatory frameworks. The EPA also promotes improved pollution control using “Best Available Control Technology” requirements.
NAAQS: National Ambient Air Quality Standards
The National Ambient Air Quality Standards (NAAQS) define legally enforceable air quality limits for six major pollutants. States may adjust industrial emission control strategies based on local air quality status.
| Pollutant | Annual Average | 24-hour Average | Notes |
|---|---|---|---|
| PM₂.₅ | 12 µg/m³ | 35 µg/m³ | Enforced nationwide |
| PM₁₀ | — | 150 µg/m³ | Children exposure limits apply |
| NO₂ | 53 ppb | 100 ppb | Focus on urban & industrial areas |
| O₃ | — | 0.070 ppm | High-value warning in summer |
| Note: NAAQS does not directly set facility emission limits. States use it to evaluate air quality and design industrial emission control paths. | |||
New Source Performance Standards (NSPS) and Best Available Control Technology (BACT)
EPA applies stricter NSPS and BACT standards for new or upgraded facilities. Key elements include:
| Pollutant | NSPS / BACT Guideline | Typical Application |
|---|---|---|
| PM | 10–20 mg/Nm³ | Drying drum exhaust treatment |
| VOCs | 20–50 mg/Nm³ | Closed storage & catalytic combustion |
| NOx | 50–150 mg/Nm³ | Low-NOx burners & combustion optimization |
Key Trends:
New and modified facilities must adopt the best available control technologies.
Emission monitoring, data logging, and compliance evaluation are mandatory.
Permit approval and technology selection are closely linked; failure to meet BACT can block project approval.
EU BAT Framework and Industrial Emissions Directive (IED)
The EU regulates industrial emissions under the Industrial Emissions Directive (Directive 2010/75/EU) and BAT Reference Documents (BREF), offering one of the most systematic global emission governance frameworks.
Core IED Requirements
All industrial facilities must obtain emission permits (IPPC / IED Permit).
Permits are based on BAT conclusions.
Facilities must implement BAT-aligned control technologies and continuously monitor emissions.
BAT Conclusions and Industry Emission Targets
BAT documents define technology guidance and reference emission levels for multiple pollutants. Example for thermal processing industries:
| Pollutant | BAT Recommendation | Typical Control Combination |
|---|---|---|
| PM | ≤5–15 mg/Nm³ | High-efficiency bag filter + pre-dust removal |
| VOCs | ≥90% removal | Adsorption regeneration + catalytic combustion |
| NOx | Optimized combustion & low-NOx | Low-NOx burners + staged combustion |
Key Technical and Management Requirements:
BAT technologies are mandatory, not advisory.
Online Continuous Emission Monitoring Systems (CEMS) are required.
Emission reporting must meet national and EU transparency standards.
BAT-driven updates continuously promote technical progress.
Environmental Upgrade Trends in Asian Markets
Asian environmental regulations are tightening quickly. Policies shift from “end-of-pipe compliance” toward “full-process control + integrated emission management.”
China: Multi-Agency Coordination and Ultra-Low Emission Standards
The Ministry of Ecology and Environment and provincial agencies have strengthened regulations through permits, ultra-low emission limits, organized emission control, and energy management.
| Regulatory System / Element | Key Requirements | Typical Indicators |
|---|---|---|
| Emission Permit System | All stationary sources must hold valid permits | Online monitoring & annual review |
| Ultra-Low Emission Standards | PM, VOCs, NOx | PM10–20 mg/Nm³ |
| Fugitive Emission Control | Mandatory enclosure and collection | Negative pressure fans + closed material yard |
| Energy & Carbon Management | Energy efficiency filing + carbon accounting | Promote clean fuel alternatives |
Key Features:
Permits are issued at the provincial level; online monitoring of PM, NOx, SO₂, and VOCs is mandatory.
Fugitive emissions are included in permit assessment.
Energy efficiency and emission reduction are jointly managed, including carbon accounting.
Southeast Asia: From Incentive-Based to Mandatory Environmental Governance
Some countries and cities introduce emission permit systems.
High-pollution industries must follow industry best-practice guidelines.
Encouraged technologies include dust removal and VOC treatment.
Certain regions now require online monitoring or third-party emission reports.
Global Regulatory Trends Driving Equipment Selection
Global policies differ but show common trends, shaping equipment configuration and technology selection.
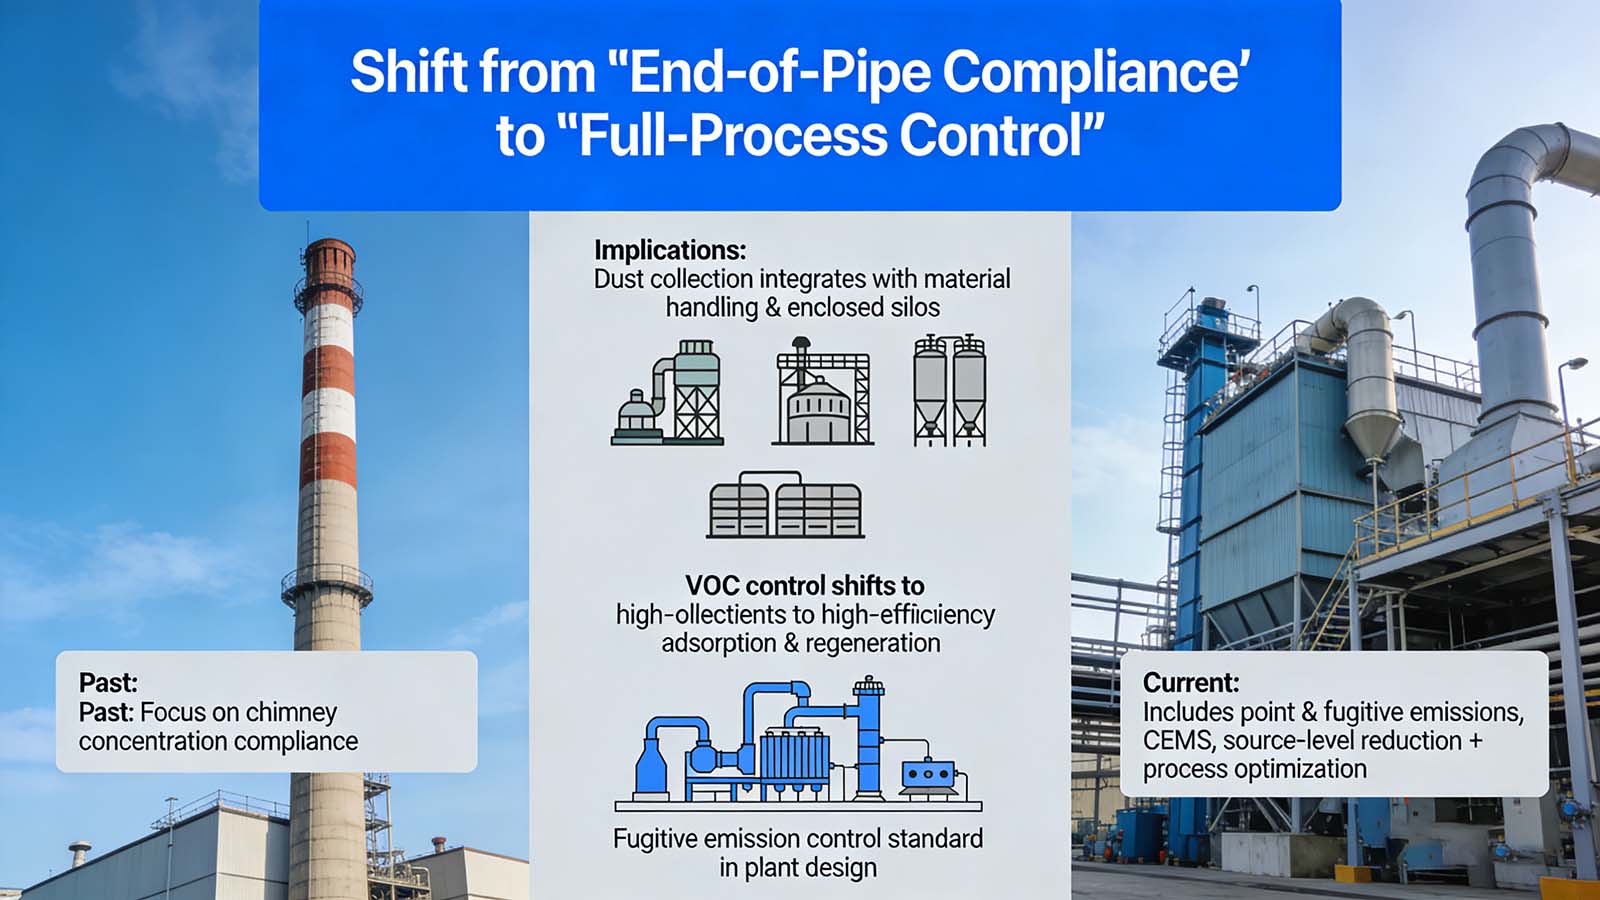
Shift from “End-of-Pipe Compliance” to “Full-Process Control”
Past: Focus on chimney concentration compliance.
Current: Includes both point and fugitive emissions, continuous online monitoring (CEMS), and source-level reduction plus process optimization.
Implications for selection:
Dust collection systems must integrate with material handling and enclosed silos.
VOC control shifts from simple combustion to high-efficiency adsorption and regeneration.
Fugitive emission control becomes standard in plant design.
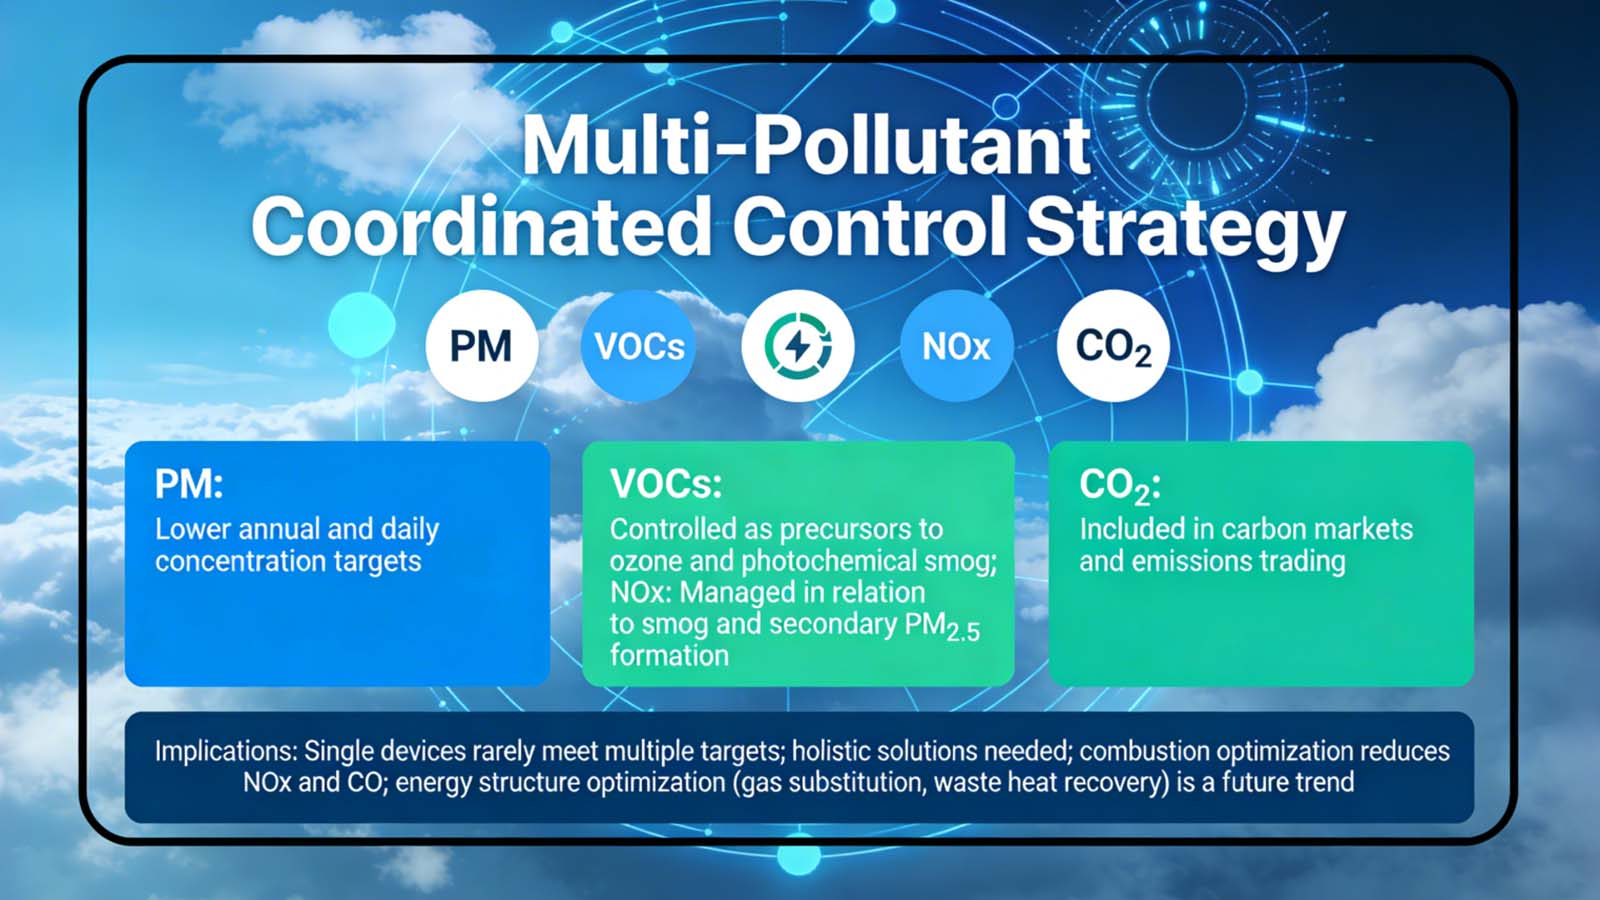
Multi-Pollutant Coordinated Control
PM: Lower annual and daily concentration targets.
VOCs: Controlled as precursors to ozone and photochemical smog.
NOx: Managed in relation to smog and secondary PM₂.₅ formation.
CO₂: Included in carbon markets and emissions trading.
Implications for selection:
Single devices rarely meet multiple targets; holistic solutions are needed.
Combustion optimization is necessary to reduce NOx and CO.
Energy structure optimization (gas substitution, waste heat recovery) is a future trend.
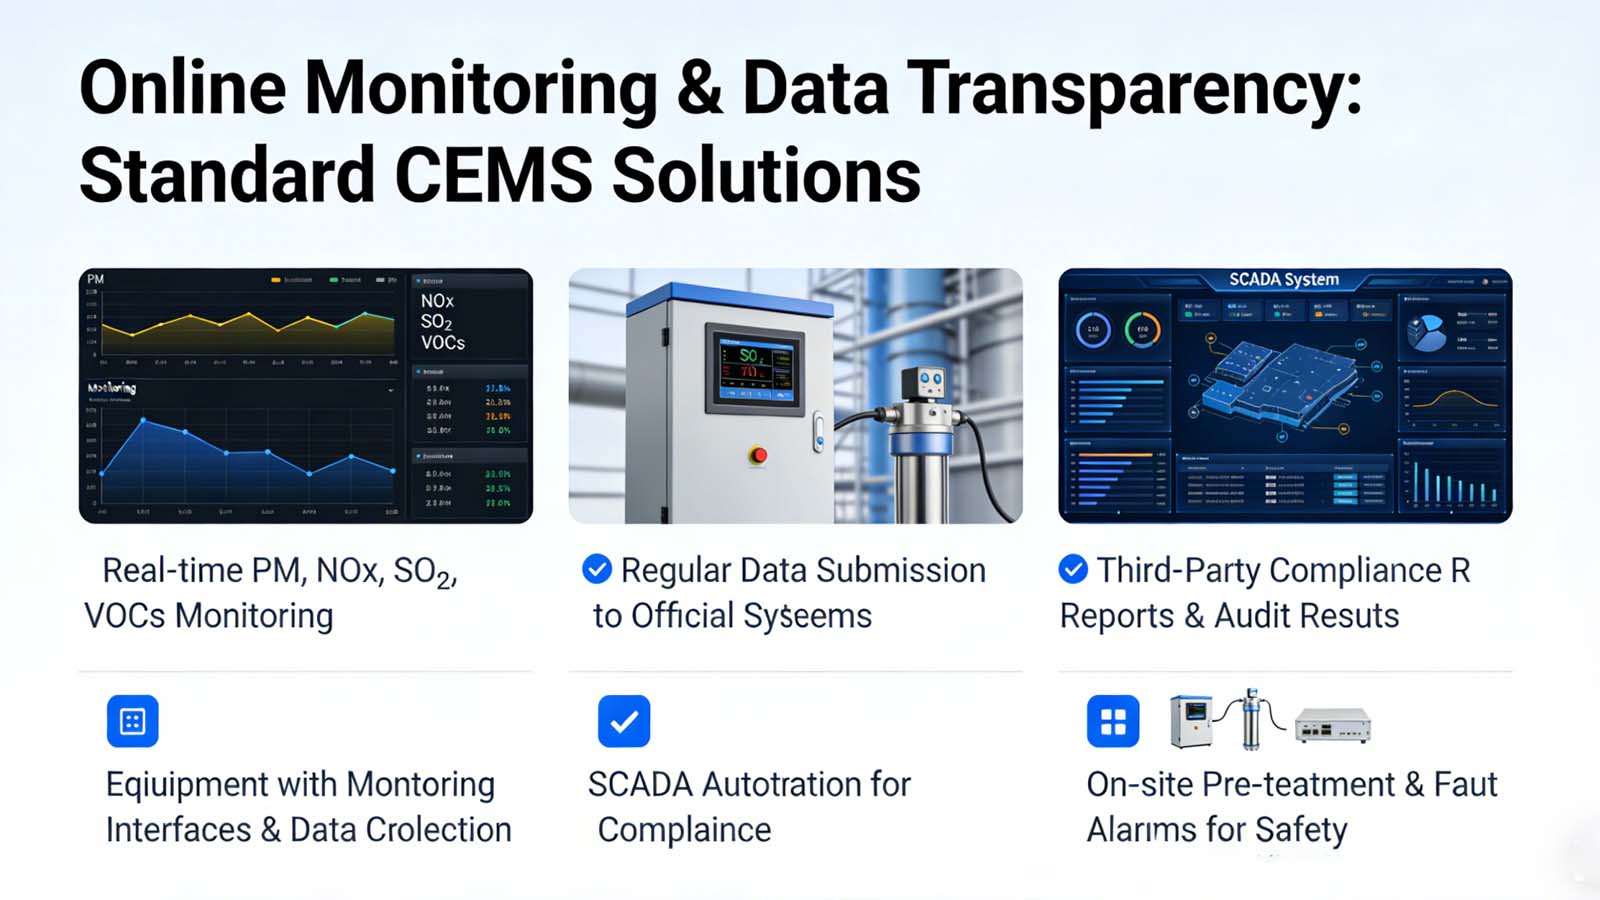
Online Monitoring and Data Transparency as Standard
CEMS: Real-time monitoring of PM, NOx, SO₂, VOCs.
Data reporting: Emission data must be regularly submitted to official systems.
Third-party verification: Compliance reports and audit results required.
Implications for selection:
Equipment must support monitoring interfaces and data collection.
SCADA and automation systems are essential for compliance.
On-site pre-treatment and fault alarm functions enhance control and safety.
Environmental technologies must operate within regulatory frameworks. Since standards vary across regions, understanding global environmental requirements is critical for equipment selection and project planning. The next chapter compares major international environmental standards and their practical implications.
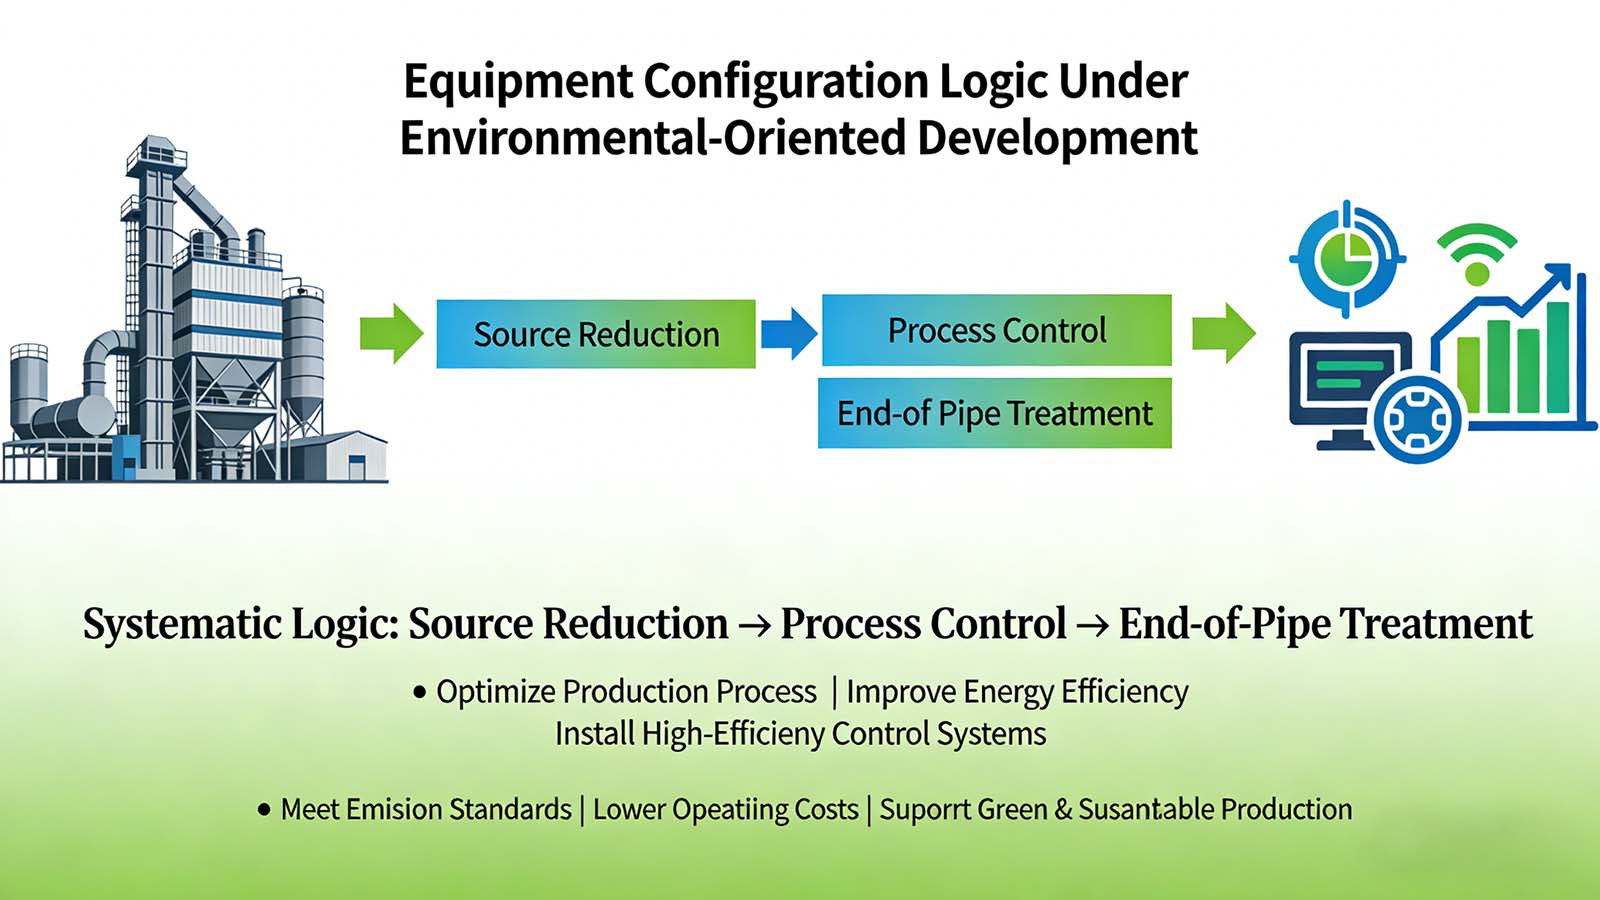
Equipment Configuration Logic Under Environmental-Oriented Development
As global environmental regulations become stricter, asphalt mixing plant configuration and process design must follow a systematic logic: Source Reduction → Process Control → End-of-Pipe Treatment. By optimizing production processes, improving energy efficiency, and installing high-efficiency control systems, operators can meet emission standards while lowering operating costs. This approach supports green and sustainable production.
Priority Principle: Source Reduction
Source reduction stands at the core of environmental strategy. The goal is simple: reduce pollutants before they form. By optimizing heating temperature, fuel structure, and combustion technology, asphalt plants can significantly reduce PM, VOCs, and NOx while maintaining production capacity.
Warm Mix Asphalt (WMA) and Low-Temperature Production
Warm Mix Asphalt (WMA) allows production at 110–140°C, compared to traditional Hot Mix Asphalt (HMA) at 150–180°C.
| Technology Type | Production Temperature | VOC Reduction | Energy Saving | Application Examples |
|---|---|---|---|---|
| HMA | 150–180°C | — | — | Conventional plants |
| WMA | 110–140°C | 30–50% | 15–25% | California, Singapore, New Zealand |
Advantages and Applications
- Lower VOC emissions: Reduced temperature minimizes asphalt evaporation.
- Reduced PM formation: Lower combustion intensity decreases smoke and dust.
- Energy and cost savings: Fuel consumption drops by about 1.5–2.0 L oil equivalent per ton.
- Improved site safety: Lower working temperature improves operator comfort.
Field data shows that WMA can reduce VOC emissions by 35–50% and PM emissions by 20–30% compared with HMA.
Fuel Optimization and Low-NOx Combustion Technology
Fuel type and combustion design directly determine NOx, SO₂, and CO formation. Source optimization focuses on fuel selection and combustion control.
| Fuel Type | Characteristics | Emission Impact | Cost & Suitability |
|---|---|---|---|
| Natural Gas | Low sulfur, stable calorific value | NOx ↓30–60%, SO₂ ≈ 0 | Medium investment, low operating cost |
| Light Oil (Diesel) | Stable ignition | NOx ↓20–40% | Low investment, suitable for small plants |
| Heavy Oil | High calorific value, high sulfur | NOx ↑, SO₂ ↑ | Low investment, high environmental cost |
Low-NOx Burner (LNB)
Low-NOx burners reduce nitrogen oxide formation through staged combustion and optimized air-fuel ratios. They apply to drying drums and heating systems and can reduce NOx by 40–50%.
| Technology Type | NOx Reduction | Investment Cost | Operating Features |
|---|---|---|---|
| Low-NOx Burner | 40–50% | Medium–High | Requires periodic maintenance |
| Staged Fuel Injection | 30–45% | Medium | Requires skilled operation |
| Waste Heat-Assisted Combustion | 20–30% | Medium | Reduces fuel consumption |
Combined Effect
By combining fuel optimization, low-NOx combustion, and WMA technology, plants can reduce total VOCs, NOx, and PM emissions by 30–60% at the source while saving 10–20% energy.
Source Reduction Design Recommendations
- Production Process: Prioritize WMA or low-temperature processes.
- Fuel Selection: Choose natural gas or low-sulfur light oil.
- Burner & Heat Source: Install low-NOx burners and optimize air-fuel ratios. Integrate waste heat recovery.
- Material Management: Use enclosed silos and sealed conveying systems to reduce fugitive emissions.
- Conclusion: Source reduction forms the foundation of environmental compliance. It directly affects downstream control and end-of-pipe performance.
Process Control and Energy Efficiency Improvement
After source reduction, process optimization further reduces emissions and improves productivity. This stage focuses on combustion efficiency, heat utilization, and material heating.
High-Efficiency Burner Configuration
High-efficiency burners play a critical role in drying drums and heating systems.
| Indicator | Conventional Burner | High-Efficiency Burner | Improvement |
|---|---|---|---|
| Thermal Efficiency | 78–82% | 85–90% | +5–10% |
| NOx (mg/Nm³) | 150–180 | 100–120 | ↓30% |
| CO (mg/Nm³) | 80–120 | 50–80 | ↓30% |
| Investment Cost | Low | Medium | — |
Benefits: Improves fuel combustion efficiency. Reduces NOx, CO, and smoke emissions. Supports multiple fuel types.
Recommendation: Medium and large asphalt plants should prioritize high-efficiency burners.
Drying Drum Thermal Optimization
The drying drum consumes the most energy in asphalt production. Structural and process upgrades can significantly improve performance.
| Optimization Measure | Effect Description | Energy Saving | Emission Impact |
|---|---|---|---|
| Liner Upgrade | Improves heat exchange | 8–12% | PM ↓5–10% |
| Nozzle & Airflow Modification | Lowers exhaust temperature | 5–8% | PM ↓10–15% |
| Variable-Diameter Drum | Improves mixing uniformity | 3–5% | CO ↓10% |
Technical Points: Use high-reflective or ceramic composite liners. Ensure uniform flue gas flow. Optimize drum inclination and diameter design.
Waste Heat Recovery System Design
Waste heat recovery captures exhaust energy for hopper preheating or WMA heating.
| System Type | Exhaust Temperature Recovery | Energy Saving | Emission Impact | Application |
|---|---|---|---|---|
| Exhaust Heat Exchanger | 200°C → 50–70°C | 8–15% | CO ↓5–10%, VOC ↓5–8% | Drying drum |
| Hopper/Asphalt Preheating | — | 5–10% | — | WMA / HMA |
| Intermittent Recovery | — | 3–5% | — | Small & medium asphalt plants |
Design Recommendations: Match recovery efficiency with flue gas flow. Integrate with WMA for dual emission reduction. Large asphalt plants use continuous recovery systems. Smaller plants may use intermittent systems.
Overall Process Benefits
Combined application of efficient burners, drum optimization, and waste heat recovery can achieve:
Total energy reduction: 10–20%
PM & CO reduction: 10–30%
VOC reduction: 20–40% (with WMA)
Key Principle: Process control must balance energy efficiency and coordinated emission reduction.
End-of-Pipe Treatment Systems
Even with strong source and process control, plants still need effective end-of-pipe systems to ensure compliance. This stage focuses on PM, VOCs, and fugitive emissions.
Multi-Stage Dust Collection System
Multi-stage dust collection captures particles from drying and screening processes.
| System Type | Removal Efficiency | Investment Cost | Operating Cost | Application |
|---|---|---|---|---|
| Cyclone + Bag Filter | 95–99% | Medium | Medium | Drying & screening exhaust |
| Electrostatic Precipitator | 98–99.5% | High | Medium–High | High particle concentration |
| Single Bag Filter | 90–95% | Low–Medium | Low–Medium | Small asphalt plants |
Design Points
Use cyclone pre-collection + high-efficiency bag filter.
Install ESP or wet scrubber for high dust loads.
Maintain filter bags regularly to keep 95–99% efficiency.
VOC Treatment Technology Comparison
| Technology | Purification Efficiency | Energy Feature | Investment | Application |
|---|---|---|---|---|
| RTO | 95–99% | High energy, heat recovery possible | High | Continuous high-load VOC |
| Catalytic Combustion | 90–98% | Medium energy | Medium–High | Stable VOC composition |
| Adsorption + Regeneration | 85–95% | Low energy | Medium | Low concentration, intermittent |
Selection Logic
High-load conditions: choose RTO or catalytic combustion.
Low concentration or intermittent: adsorption + regeneration works efficiently.
Integrate VOC treatment with waste heat recovery and WMA for comprehensive reduction.
Fugitive Emission Control
Fugitive emissions originate from material yards, conveyors, and storage tanks.\
| Control Measure | Reduction Effect | Cost Level | Technical Key Point |
|---|---|---|---|
| Enclosed Yard & Conveyor | PM ↓50–80% | Medium | Negative pressure dust fan |
| Sealed Storage Tanks | PM ↓40–60% | Low–Medium | Vent + filtration system |
| Local Adsorption + Duct Collection | VOC ↓30–50% | Medium | Integrate with WMA |
Practical Experience
Combined with source control, fugitive PM can drop 50–80%.
VOC fugitive emissions can decrease 30–50%.
Conduct regular inspection of fans, ducts, and adsorption beds.
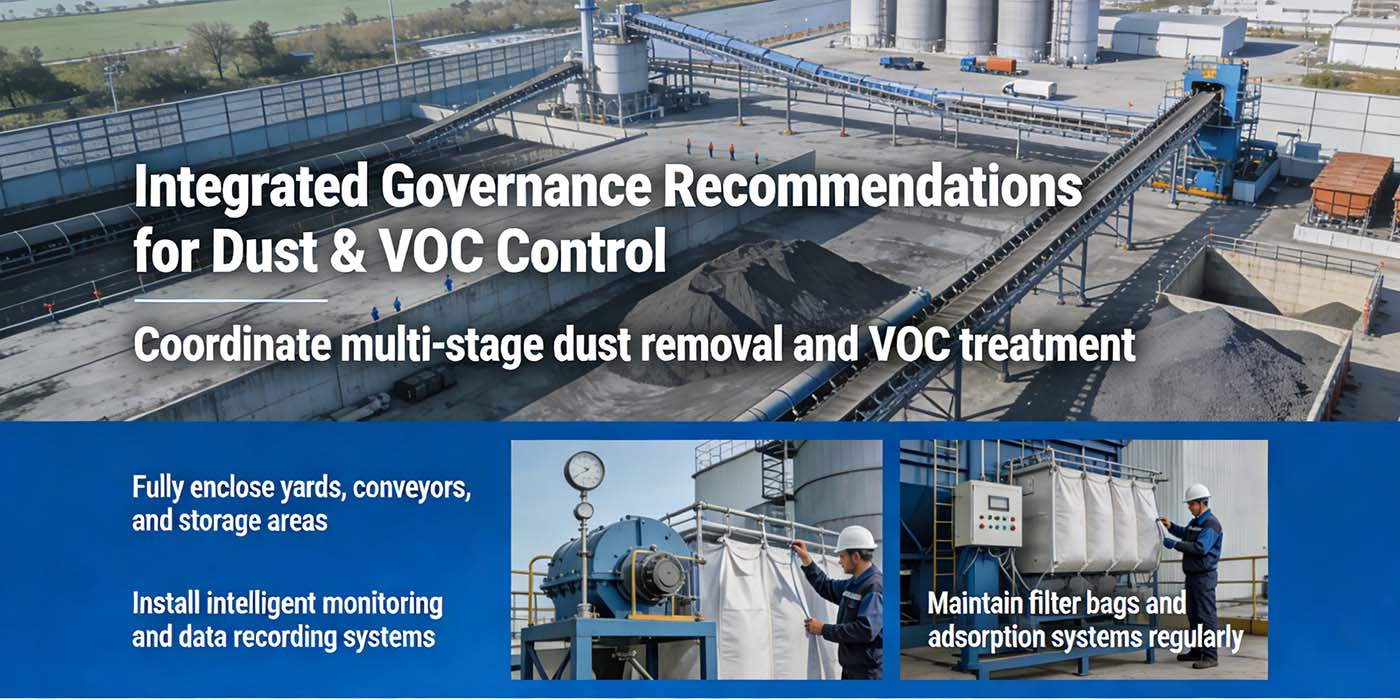
Integrated Governance Recommendations
Coordinate multi-stage dust removal and VOC treatment.
Fully enclose yards, conveyors, and storage areas.
Install intelligent monitoring and data recording systems.
Maintain filter bags and adsorption systems regularly.
Conclusion: End-of-pipe systems act as the final compliance safeguard. When combined with source reduction and process optimization, they ensure full-process emission control and sustainable plant operation.
Closed-Loop Environmental Equipment Strategy
An environmentally oriented asphalt plant should follow this closed-loop framework:
With regulatory requirements clearly defined, the next step is to translate those standards into practical engineering decisions. Equipment configuration and process optimization play a decisive role in achieving both compliance and operational efficiency. Next, we will explore how to align technology selection with environmental and economic goals.
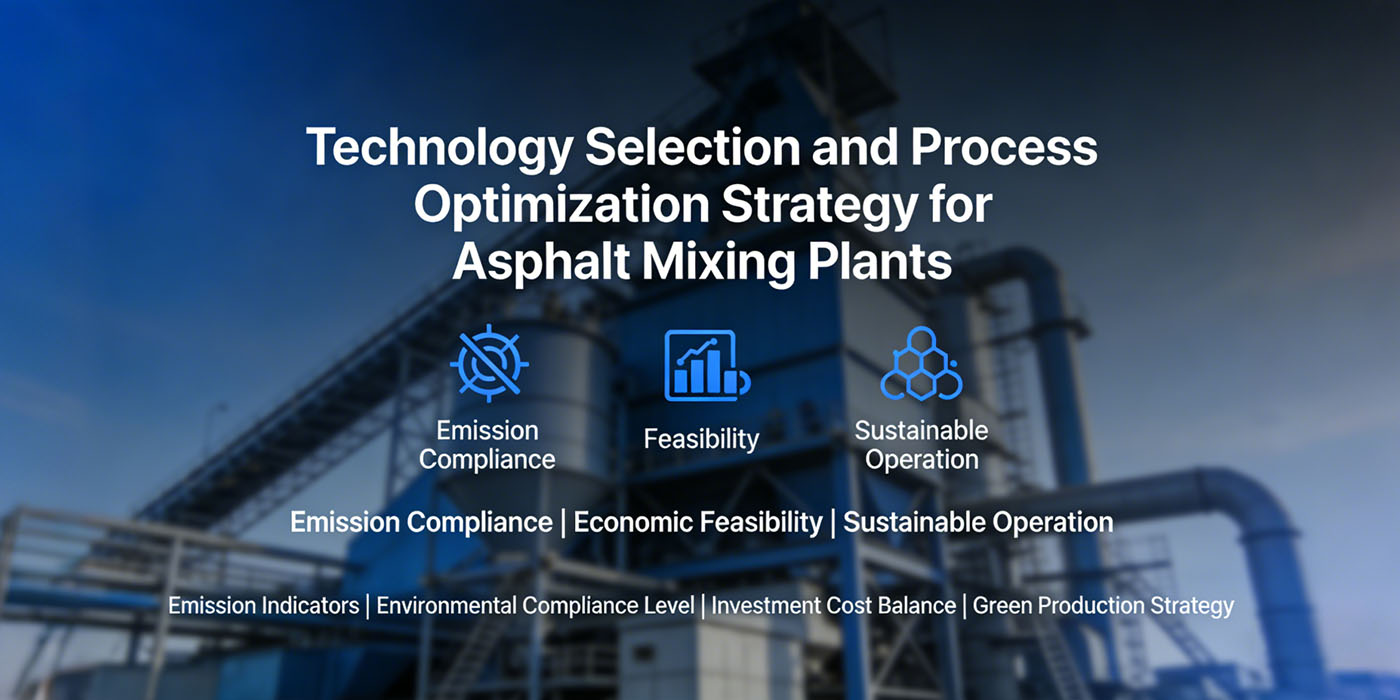
Technology Selection and Process Optimization Strategy
As global environmental regulations tighten, asphalt mixing plant technology selection and process optimization must focus on three core principles: emission compliance, economic feasibility, and sustainable operation. A well-designed selection strategy not only determines regulatory compliance but also directly affects productivity and operating costs. This chapter analyzes equipment selection and process optimization from four dimensions: emission indicators, environmental compliance level, investment cost balance, and green production strategy.
Equipment Selection Logic Based on Emission Indicators
Technology selection should first align with emission limits. Key indicators include PM, VOCs, NOx, CO, and fugitive emissions. Equipment must match regulatory requirements before considering capacity and cost.
| Emission Indicator | Compliance Requirement (Examples) | Recommended Equipment / Technology | Configuration Suggestion |
|---|---|---|---|
| PM (PM10/PM2.5) | 10–50 mg/Nm³ | Multi-stage dust collection (Cyclone + Bag Filter / ESP) | Cyclone pre-collection + secondary bag filter |
| VOCs | 20–50 mg/Nm³ | RTO, catalytic combustion, adsorption + regeneration | High concentration: RTO / catalytic; Low concentration: adsorption |
| NOx | 50–150 mg/Nm³ | Low-NOx burner, optimized air-fuel ratio | Drying drum + low-NOx burner |
| CO | 50–100 mg/Nm³ | High-efficiency burner, waste heat recovery | Integrate burner adjustment + heat recovery |
| Fugitive Emissions | PM ↓50–80% | Enclosed silos, sealed conveyors, local adsorption | Enclosed yard + duct collection + local adsorption |
Selection Logic: Emission compliance acts as a hard constraint. After meeting regulatory thresholds, operators should evaluate production capacity, operational efficiency, and maintenance convenience. This structured approach ensures a balanced and compliant system configuration.
Process Optimization Under Different Environmental Compliance Levels
Environmental requirements vary by country and region. Asphalt plants can classify process optimization into three categories: Basic Compliance, Advanced Environmental, and Green Low-Carbon.
| Environmental Level | Main Characteristics | Process Optimization Strategy | Typical Application |
|---|---|---|---|
| Basic Compliance | Meets national/local standards | Standard burner + cyclone & bag filter + simple heat recovery | Small or low-capacity plants |
| Advanced Environmental | Exceeds regulations, improves energy efficiency | Low-NOx burner + multi-stage dust collection + RTO/catalytic combustion + WMA | Suburban urban plants, medium capacity |
| Green Low-Carbon | Low carbon + energy optimization + sustainability | Full WMA process + high-efficiency burner + heat recovery + enclosed yard + intelligent monitoring | Highways, airports, large infrastructure |
Explanation: Higher environmental levels require greater investment and operational complexity. Companies should evaluate regulatory pressure, production demand, and financial capacity before choosing the optimal solution.
Balancing Investment Cost and Compliance Risk
When selecting environmental equipment and processes, companies must balance initial investment, operating cost, and compliance risk.
| Solution Type | Initial Investment | Annual Operating Cost | Emission Risk | Overall Score (1–5, 5 Best) |
|---|---|---|---|---|
| Basic Compliance | Low | Medium | Medium | 3 |
| Advanced Environmental | Medium | Medium–High | Low | 4 |
| Green Low-Carbon | High | High | Very Low | 5 |
Strategic Recommendations
- Strict regulatory regions: Prioritize advanced or green low-carbon solutions to reduce long-term compliance risk.
- Small or temporary projects: Basic compliance solutions offer lower investment and meet current standards.
- Long-term operation planning: Evaluate full life-cycle costs, including energy use, maintenance, and potential penalties. Green low-carbon solutions often provide stronger long-term economic returns.
Green Production and Sustainable Operation
Modern asphalt plants must go beyond emission compliance. Energy conservation, carbon reduction, and long-term sustainability now shape equipment decisions.
| Green Production Measure | Effect and Value |
|---|---|
| Warm Mix Asphalt (WMA) | Energy ↓15–25%, VOC ↓30–50% |
| Waste Heat Recovery | Energy saving 8–15%, CO & VOC reduction |
| Intelligent Monitoring & Data Analysis | Real-time emission tracking, predictive maintenance, operational optimization |
| Renewable Energy Assistance | Solar or biomass heating reduces fossil fuel dependence |
| Full Enclosure Design | Fugitive emission ↓50–80%, improved plant environment |
Comprehensive Recommendation: Companies should treat green production as a long-term strategy. Equipment selection and process optimization must align environmental compliance, energy efficiency, and sustainable development goals.
Technical configuration provides the foundation for compliance, but long-term stability depends on effective monitoring and management. Real-time data and intelligent systems help maintain consistent performance under changing production conditions. The next chapter discusses smart monitoring and operational control systems.
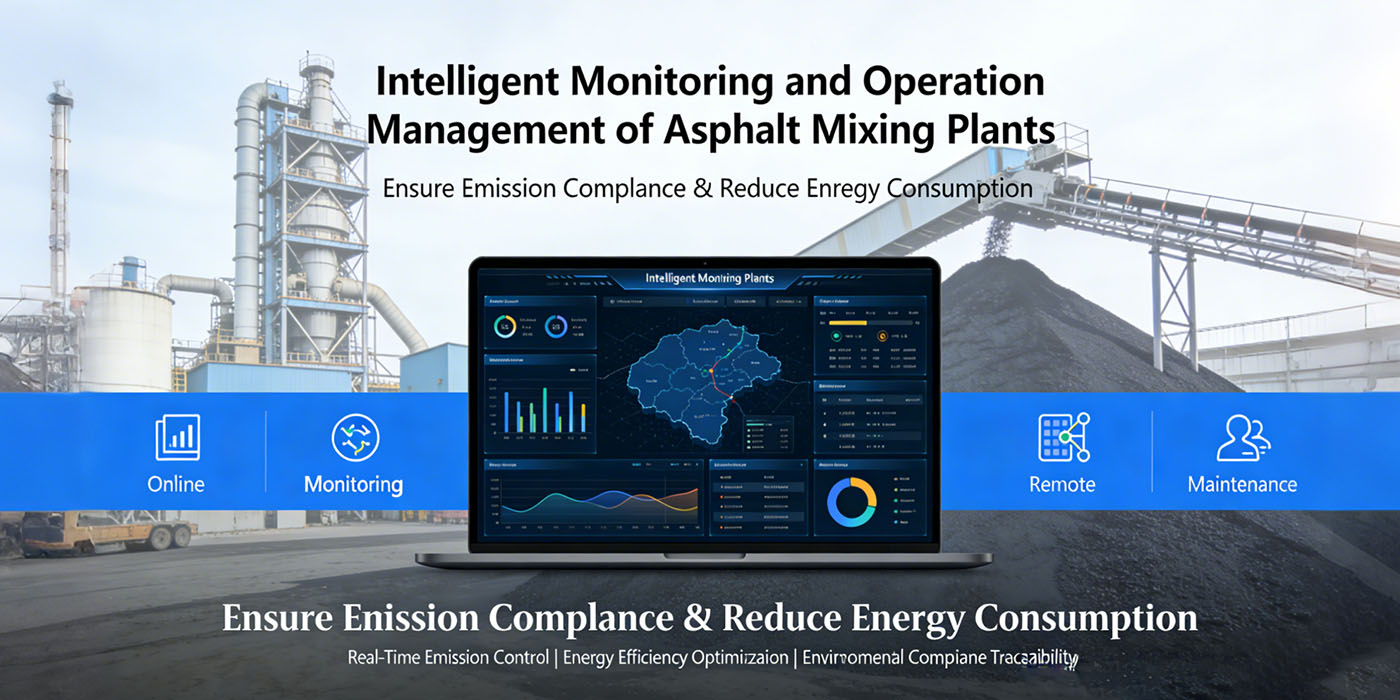
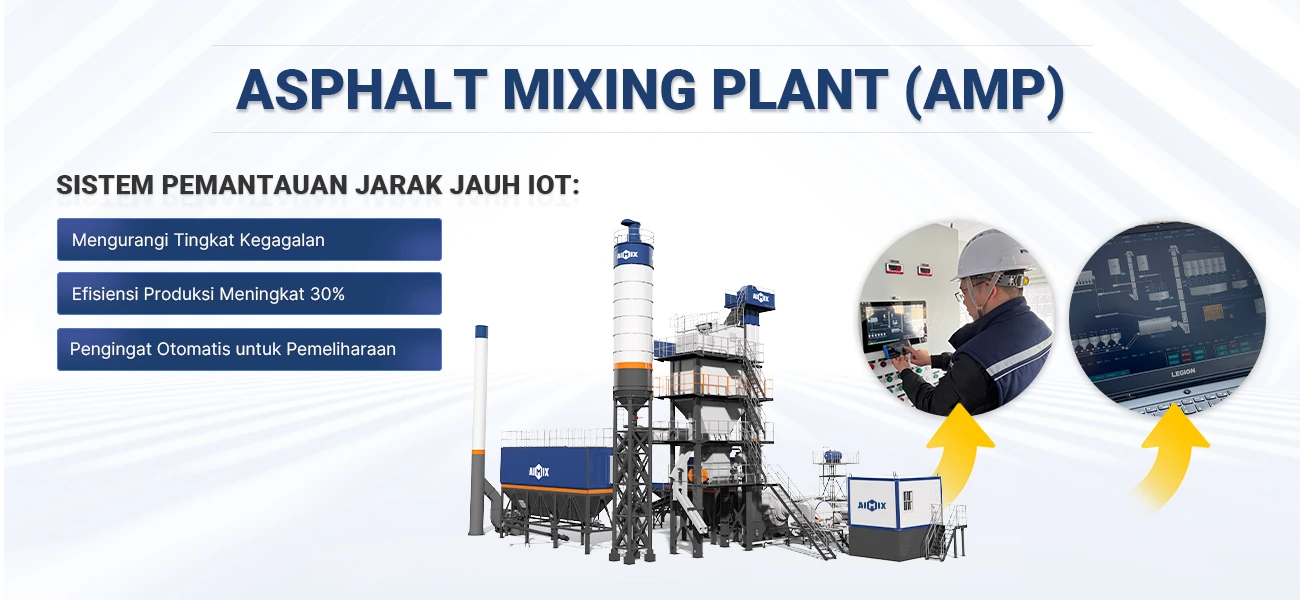
Intelligent Monitoring and Operation Management
As environmental regulations become stricter and digital technologies advance, intelligent monitoring and operation management have become essential for asphalt mixing plants. These systems help ensure emission compliance, reduce energy consumption, and support sustainable operation. Through online monitoring, data analysis, and remote maintenance, operators can achieve real-time emission control, energy efficiency optimization, and environmental compliance traceability.
Application of CEMS (Continuous Emission Monitoring System)
CEMS enables real-time monitoring of particulate matter, VOCs, NOx, CO, and other emission indicators.
| Indicator Type | Monitoring Range | Data Update Frequency | Main Function |
|---|---|---|---|
| PM2.5 / PM10 | 0–500 mg/Nm³ | 1–5 minutes | Tracks particulate emission levels in real time |
| VOCs | 0–200 mg/Nm³ | 1–5 minutes | Guides WMA, RTO, or catalytic combustion adjustment |
| NOx / CO | 0–500 mg/Nm³ | 1–5 minutes | Supports low-NOx burner optimization and fuel regulation |
| Temperature / Flow Rate | — | 1 minute | Supports production control and energy efficiency analysis |
Application Value
Provides real-time emission visibility and prevents exceedance.
Allows integration with SCADA systems for automatic parameter adjustment.
Supports online supervision by environmental authorities and internal compliance tracking.
Field applications show that CEMS combined with process optimization can reduce NOx emissions by 10–20% and VOC emissions by 5–10%.
Data-Driven Emission Control Mechanisms
Based on monitoring data, asphalt plants can establish emission control models. These models maintain a dynamic balance between production performance and emission levels.
| Control Strategy | Implementation Method | Effect |
|---|---|---|
| Temperature Control | Adjust mixing temperature based on VOC and PM data | VOC ↓5–15% |
| Airflow and Pressure Optimization | Adjust drying drum airflow and dust collection airflow | PM ↓5–10% |
| Fuel and Burner Adjustment | Optimize air-fuel ratio and nozzle position in low-NOx burners | NOx ↓10–20% |
| Automatic Process Feedback | CEMS data triggers PLC or SCADA automatic adjustment | Stabilizes overall emissions |
Advantages
Enables dynamic production control and avoids manual response delays.
Improves equipment efficiency and reduces energy waste.
Provides reliable compliance documentation and reduces penalty risk.
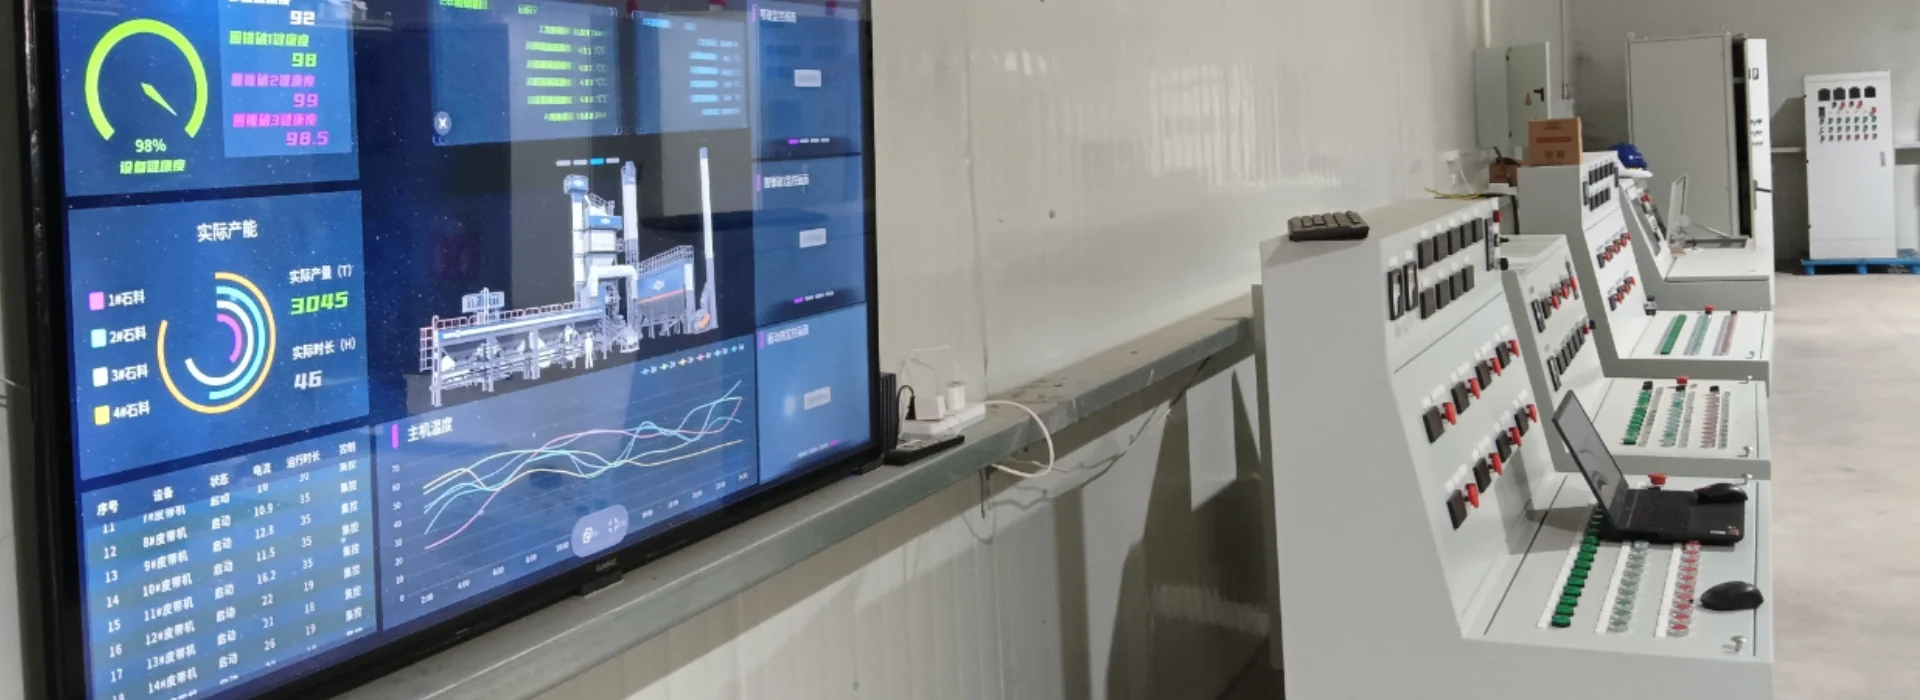
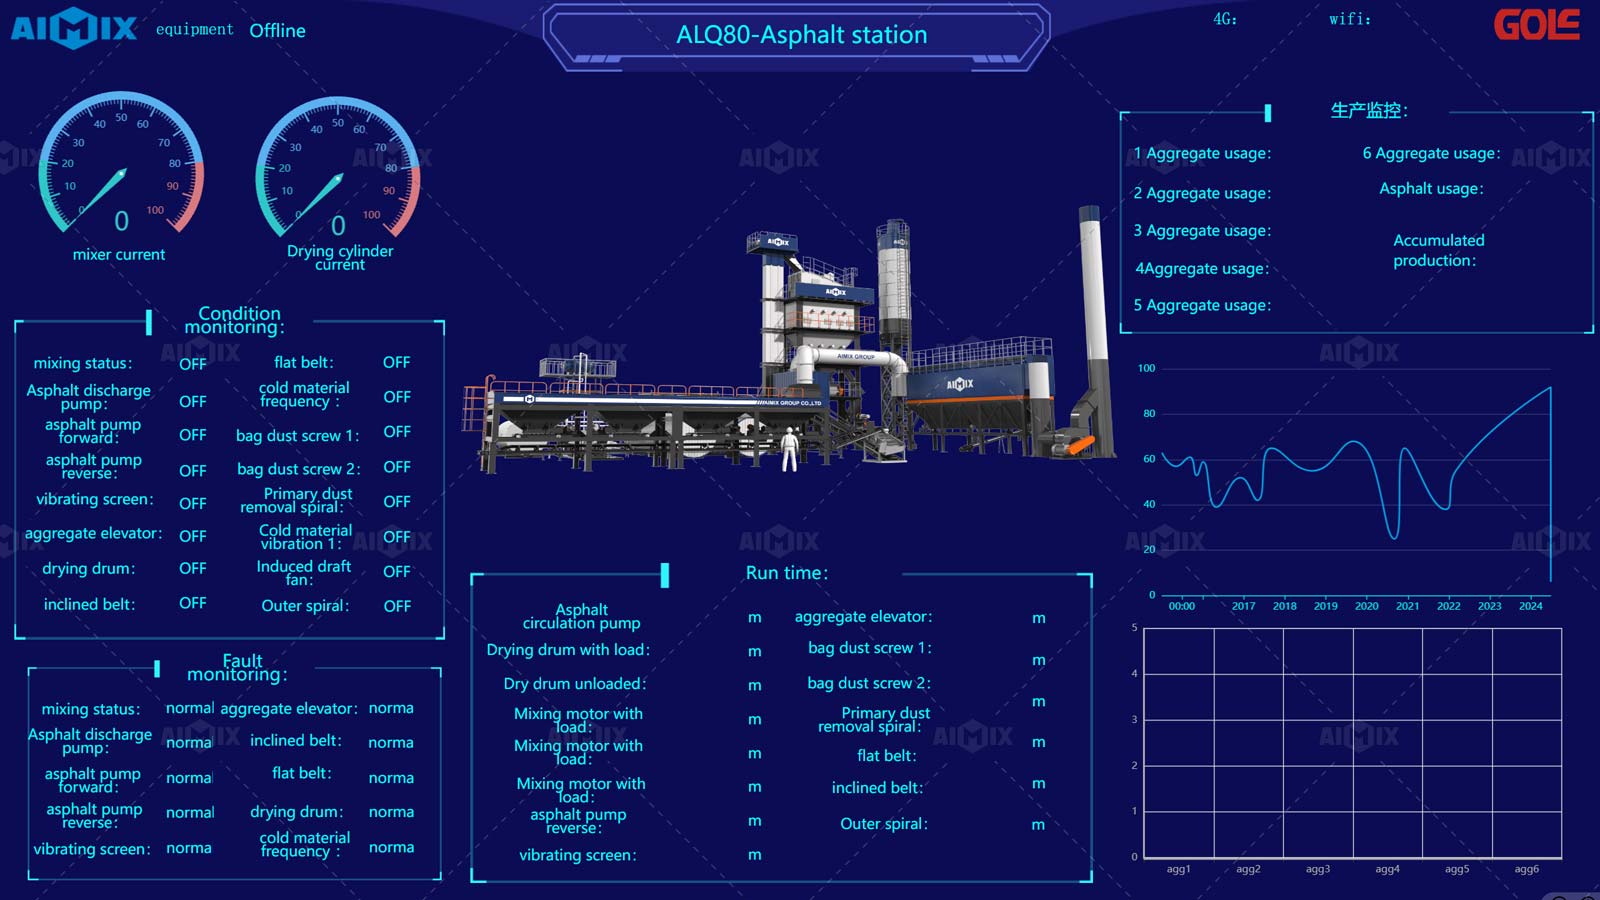
SCADA and Remote Operation & Maintenance Management
SCADA (Supervisory Control and Data Acquisition) systems support production monitoring, data acquisition, and remote operation management.
| Functional Module | Core Function | Practical Effect |
|---|---|---|
| Real-Time Production Monitoring | Monitors silo, drum, heating, and dust collection parameters | Detects production abnormalities quickly |
| Data Recording and Analysis | Records energy consumption, emissions, and temperature data | Supports emission optimization and energy saving |
| Remote O&M Management | Enables remote parameter adjustment and equipment status monitoring | Reduces manual inspection cost by 10–15% |
| Fault Alarm and Prediction | Detects equipment failure, bag filter blockage, and abnormal temperature | Reduces downtime and extends equipment lifespan |
Combined with intelligent sensors and PLC systems, SCADA enables continuous automated plant operation. It ensures stable production performance and emission compliance.
Environmental Data Compliance and Traceability Management
Intelligent monitoring systems also ensure data compliance, traceability, and audit readiness.
| Data Type | Functional Description | Compliance Value |
|---|---|---|
| Emission Data | Real-time recording of PM, VOCs, NOx, and CO | Supports environmental inspections and reduces compliance risk |
| Process Parameters | Tracks temperature, fuel consumption, and airflow | Helps optimize production and trace emission sources |
| Operation & Maintenance Records | Records maintenance schedules, filter replacement, and adsorption bed regeneration | Supports ISO and environmental management systems |
| Energy Consumption Data | Tracks electricity and fuel consumption | Supports green production evaluation and carbon management |
Implementation Recommendations
Integrate data monitoring with process control systems to create closed-loop management.
Install automated reporting modules for regulatory submission and internal audits.
Maintain data storage for at least five years to meet international environmental compliance and traceability requirements.
Once intelligent monitoring systems are in place, the focus moves to full-system integration. Environmental performance improves when structural design, airflow control, combustion systems, and digital management work together. Let’s learn what presents a systematic engineering approach to achieving this integration in the following.
How Our Asphalt Plants Systematically Respond to Global Environmental Upgrades
As global environmental regulations become stricter, environmental performance can no longer rely on a single piece of equipment. Asphalt plants must respond through a full-process system approach. Our asphalt plants achieve a closed-loop green production system. The solution integrates structural design, fully enclosed negative-pressure collection, end-of-pipe treatment, multi-fuel low-NOx combustion, and flexible environmental level adaptation. It controls emissions from source to terminal treatment.
Building an Environmental Protection System at the Design Stage
Our R&D team embeds environmental principles into the entire process during the design stage. The system combines source reduction, process optimization, and precise parameter control.
Source Reduction
Adopt Warm Mix Asphalt (WMA) and low-temperature production design. This reduces VOC emissions without affecting mix quality.
Optimized Plant Layout
Apply airflow simulation to silos, weighing systems, and conveying paths. A fully enclosed structure reduces dust diffusion and cuts fugitive emissions by 50–80%.
Critical Parameter Control
Link combustion temperature, material moisture, and production rhythm to emission indicators. Use high-precision weighing systems (aggregate error ±0.5%, powder/asphalt error ±0.25%) to ensure stable product quality.
Modular and Durable Structure
Pipelines and telescopic devices allow ±3 cm installation tolerance. This shortens installation time by 10–20%. Wear-resistant upgrades for mixing blades, hot aggregate bins, and finished product silos (≥160 t) support million-ton output capacity.
| Design Stage | AIMIX Solution | Environmental Function |
|---|---|---|
| Process Flow | Source reduction → Process optimization → Exhaust treatment | Closed-loop control of PM2.5, VOCs, and NOx |
| Plant Layout | Fully enclosed silos & conveying + airflow simulation | Fugitive emissions ↓50–80%, reduced dust dispersion |
| Parameter Design | Intelligent temperature control, combustion efficiency, moisture control + high-precision weighing | Stable production and reduced emission fluctuation |
| Modular Installation | Telescopic pipeline design (±3 cm tolerance) | Installation time ↓10–20%, higher construction efficiency |
| Wear-Resistant Structure | Upgraded blades and silos | Supports million-ton output and long-term stable production |
Fully Enclosed Structure and Negative Pressure Collection
We apply fully enclosed systems combined with negative-pressure collection at key emission points.
Core Measures
- Fully Enclosed Silos and Conveying Systems: Seal aggregate storage, weighing, and conveying processes to prevent dust escape.
- Negative-Pressure Collection: Install high-efficiency suction at dryer drum outlets and truck loading points. Direct captured gas to treatment system.
- Optimized Airflow Direction: Use asphalt plant airflow simulation to minimize environmental impact.
- Performance: Adjustable negative-pressure airflow. PM2.5 collection efficiency ≥90%. Fully enclosed systems reduce dust escape by 50–80%.
Integrated High-Efficiency Dust Removal and VOC Control
We integrate dust removal and VOC treatment systems. The design improves efficiency and lowers energy consumption.
Technical Features
Multi-Stage Dust Removal: Combine bag filters and electrostatic systems. PM2.5/PM10 capture efficiency reaches 90–95%.
Flexible VOC Treatment Options: Catalytic combustion, activated carbon adsorption, or photocatalytic oxidation. Configure based on production capacity and asphalt type.
Integrated Duct Design: Shorten duct length and reduce airflow loss. Lower operating energy consumption.
Operational Results: Projects in Southeast Asia and coastal China show VOC emission reductions of 30–50%.
| Treatment Type | AIMIX Solution | Performance / Environmental Function | Applicable Market |
|---|---|---|---|
| Particulates | Bag filter + electrostatic combination | PM2.5/PM10 capture 90–95% | High-standard global markets |
| VOCs | Catalytic combustion / Activated carbon / Photocatalytic | VOC ↓30–50% | EU / USA / Southeast Asia |
| System Integration | Integrated dust + VOC system | Low airflow loss, reduced energy use | Global application |
Multi-Fuel Compatibility and Low-NOx Combustion System
The AIMIX combustion system supports multiple fuels while maintaining low NOx emissions.
Core Capabilities
Fuel Flexibility: Compatible with diesel, natural gas, LPG, and renewable fuel blends. Adapts to different market fuel supplies.
Low-NOx Burner: Use staged air premix combustion design. Reduce NOx emissions by 20–40%.
Intelligent Temperature Control: Adjust burner power and airflow in real time. Ensure complete combustion and reduce CO and unburned emissions.
Performance: Burner efficiency ≥95%. NOx emissions ≤150 mg/Nm³ (adjustable according to local standards).
Adaptation to Different Environmental Standards
AIMIX asphalt plants use modular configuration and intelligent monitoring. This allows adaptation to global environmental standards.
Key Measures
| Market / Standard | AIMIX Adaptation | Core Environmental Function | Performance Indicator |
|---|---|---|---|
| EU BAT / IED | Multi-stage dust removal + catalytic combustion + WMA | Strict PM2.5 & VOC control | PM2.5 ≤10 mg/Nm³, VOC ↓30–50% |
| US EPA BACT | Low-NOx combustion + full enclosure + CEMS | Low VOC & NOx emissions | NOx ≤150 mg/Nm³, PM2.5 ≤15 mg/Nm³ |
| Southeast Asia / Coastal China | WMA + bag filter + intelligent control | Meets upgraded emission standards | VOC ↓20–40%, PM2.5 ≤20 mg/Nm³ |
| Global General | Modular treatment system | Flexible combination & fast switching | Adaptation within 30 minutes |
System integration ensures stable compliance today, but the industry is also moving toward deeper carbon reduction and sustainable production. New technologies and policy trends are reshaping how asphalt plants operate. The next chapter explores future directions, including RAP utilization, electrification, carbon accounting, and smart green factories.
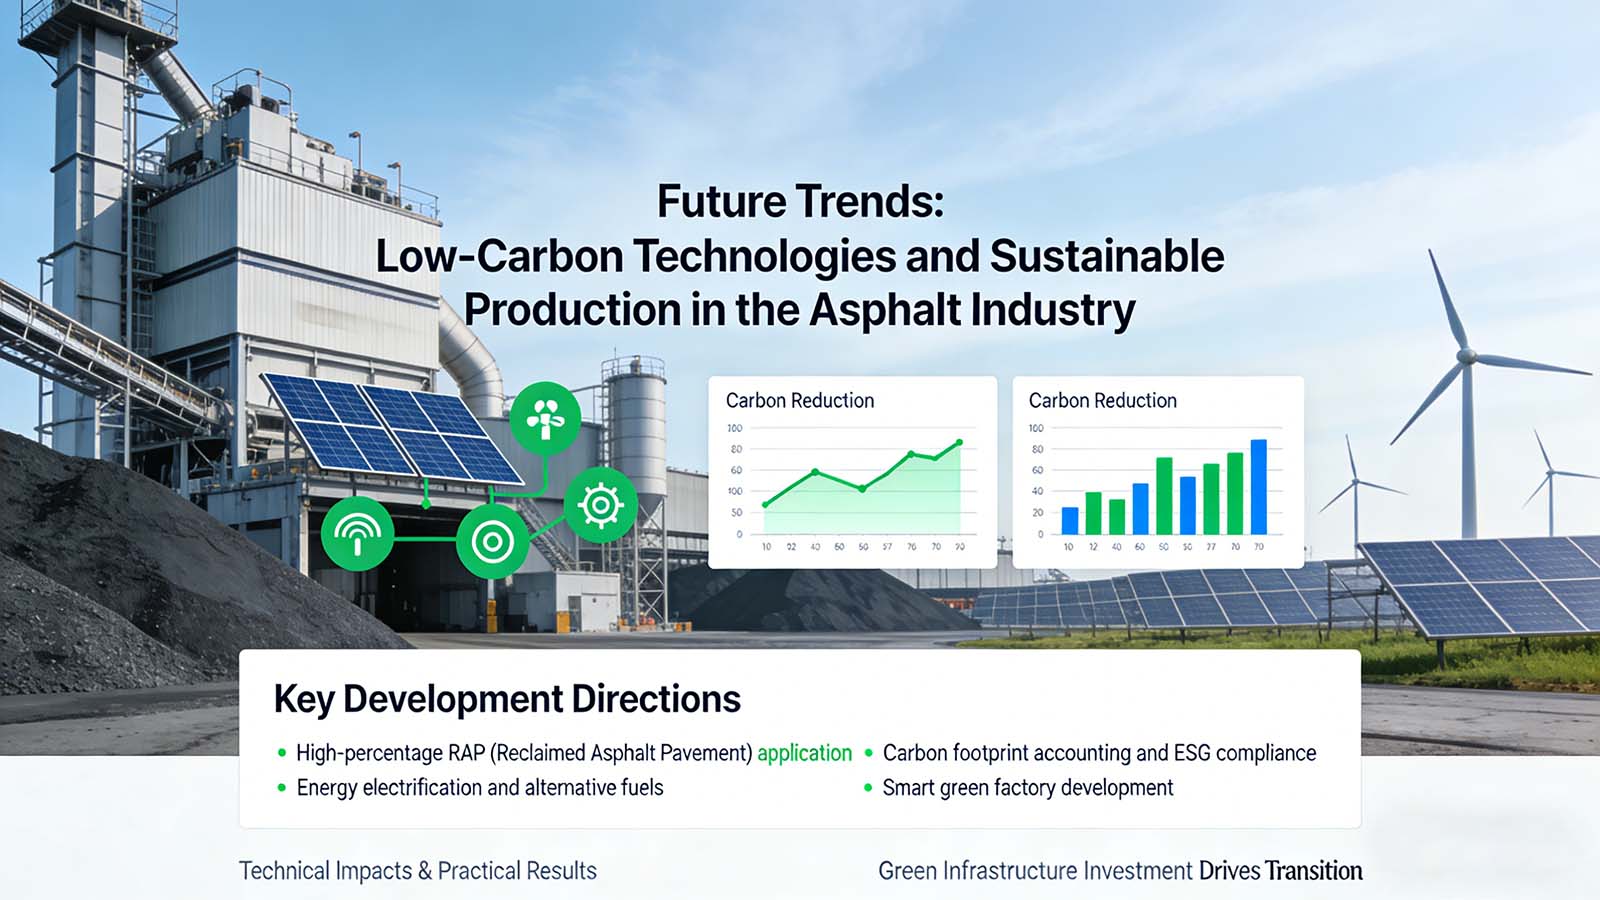
Future Trends: Low-Carbon Technologies and Sustainable Production
As global environmental regulations tighten and carbon neutrality goals accelerate, the asphalt industry is moving toward low-carbon and sustainable production. Green infrastructure investment also drives this transition. Future development will focus on four key directions:
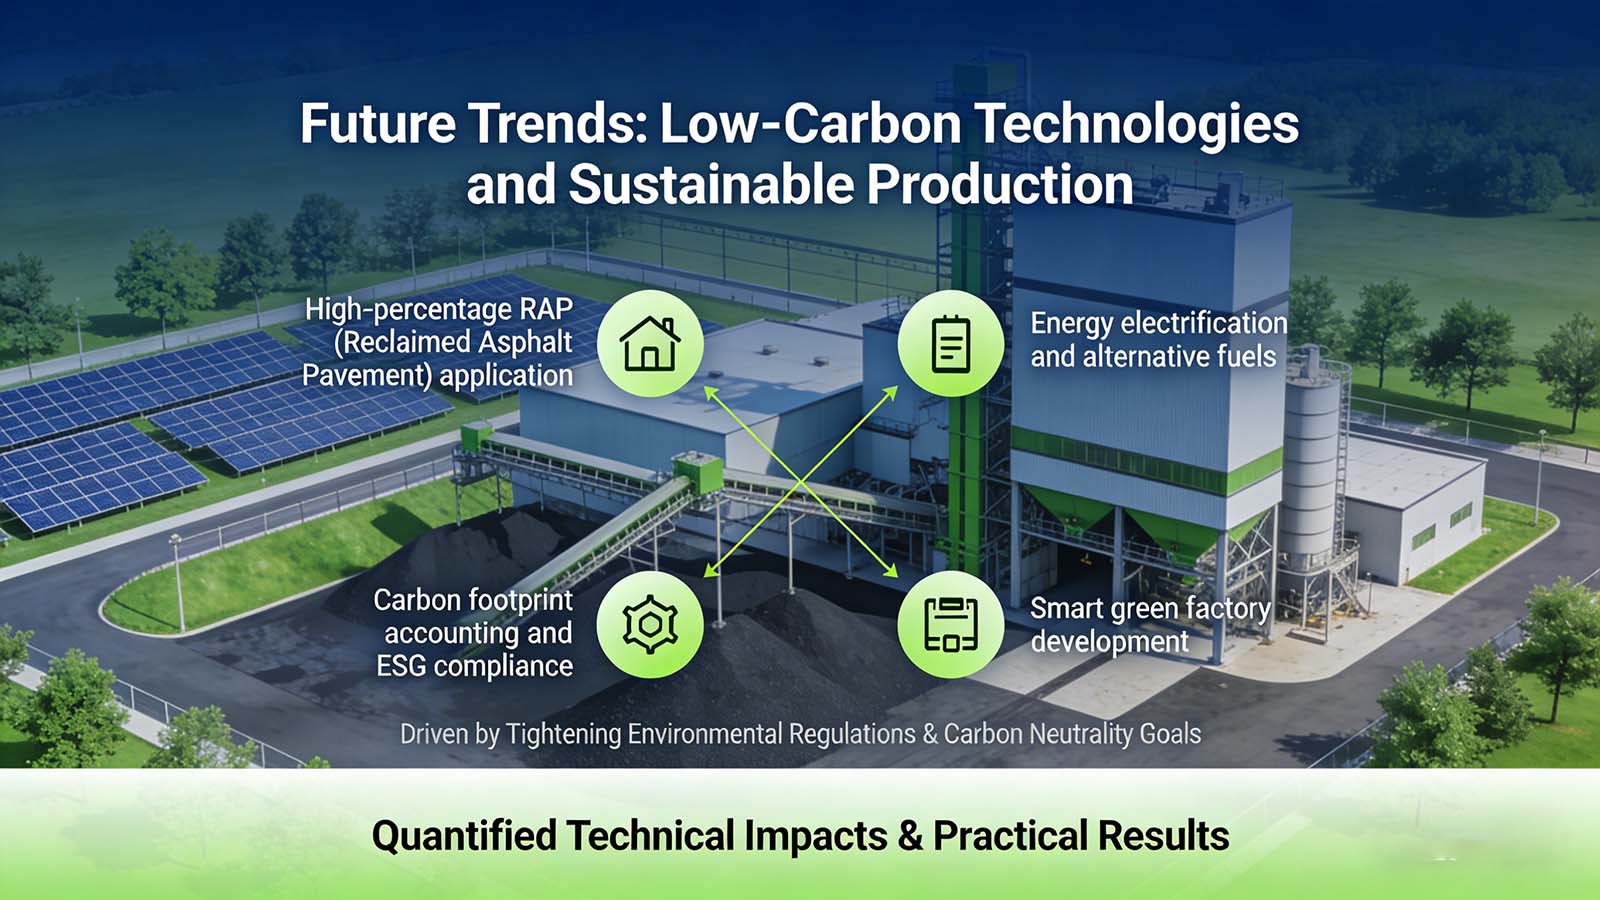
Below are the quantified technical impacts and practical results.
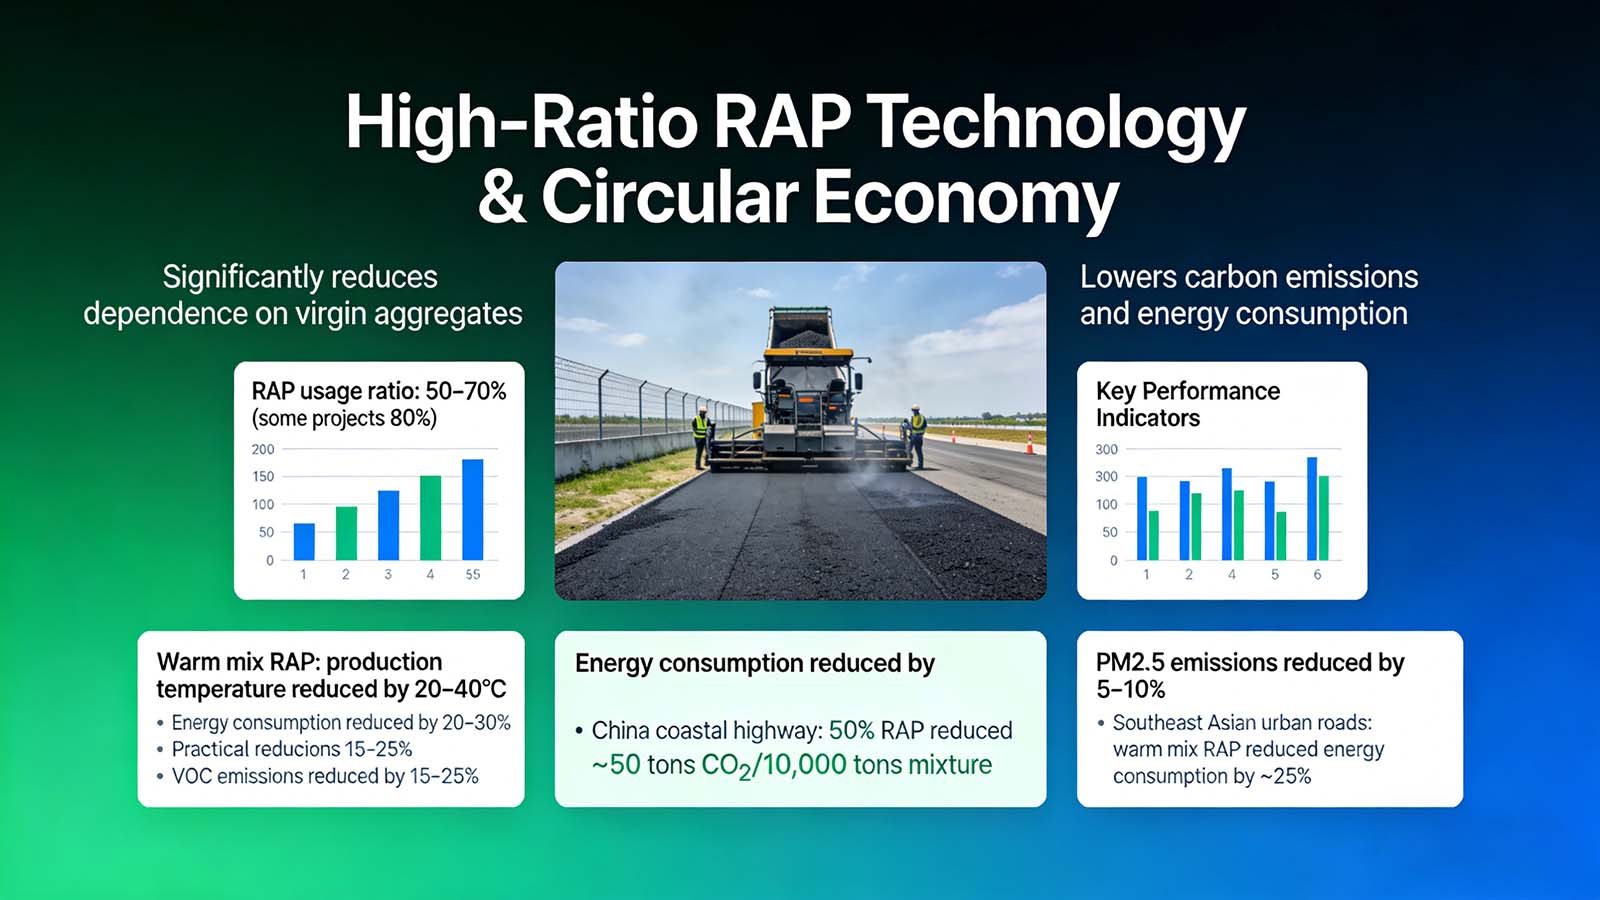
High-Ratio RAP Technology and Circular Economy
High-percentage RAP significantly reduces dependence on virgin aggregates. It also lowers carbon emissions and energy consumption.
Key Performance Indicators
RAP usage ratio: 50–70%, with some projects reaching 80%
Warm mix RAP process: production temperature reduced by 20–40°C
Energy consumption reduced by 20–30%
VOC emissions reduced by 15–25%
PM2.5 emissions reduced by 5–10%
Practical Results
In coastal highway rehabilitation projects in China, 50% RAP reduced approximately 50 tons of CO₂ per 10,000 tons of mixture.
| Technical Measure | Ratio / Condition | Energy & Emission Impact | Project Case |
|---|---|---|---|
| High-Ratio RAP | 50–70% | Energy ↓20–30%, CO₂ ↓≈50 t per 10,000 t mix | Coastal China highway rehabilitation |
| Warm Mix RAP | Low-temperature mixing (-20–40°C) | VOC ↓15–25%, PM2.5 ↓5–10% | Southeast Asia urban renewal |
| Circular Economy | Reuse of old pavement materials | Virgin aggregate ↓≈50%, higher resource efficiency | Global applications |
High-ratio RAP is not only a material strategy. It forms the foundation of circular asphalt production.
Electrification and Alternative Energy Transition
Traditional asphalt production relies heavily on fuel-based heating. The industry is gradually shifting toward electrification, natural gas, and renewable energy integration.
- Energy Mix Strategy: Natural gas and LPG, Electric heating, Solar-assisted systems, Hybrid multi-energy switching Asphalt plants can adapt energy combinations according to local supply conditions.
- Low-Carbon Performance: Electric heating combined with gas reduces fuel consumption by 20–25%; CO₂ emissions decrease by 15–20%.
- Field Application Data: In Indonesia and Middle Eastern markets, Electric preheating covers 50–70% of aggregate heating; Gas supports final heating; Each production batch reduces carbon emissions by approximately 12–15 tons.
| Energy Type | Application Method | Energy & Emission Reduction | Project Practice |
|---|---|---|---|
| Natural Gas | Drying drum & heating | NOx ↓20–30%, cleaner combustion | Large Southeast Asia municipal project |
| Electric Heating | Aggregate preheating & drying | Energy ↓10–15%, CO₂ ↓8–10% | Indonesian coastal road upgrade |
| Solar Assistance | Preheating water/material | Fuel saving 5–8% | Asia-Pacific green city project |
| Hybrid Energy | Flexible multi-energy switching | Total CO₂ ↓15–20% | Global low-carbon demonstration projects |
Energy flexibility strengthens long-term carbon reduction capability.
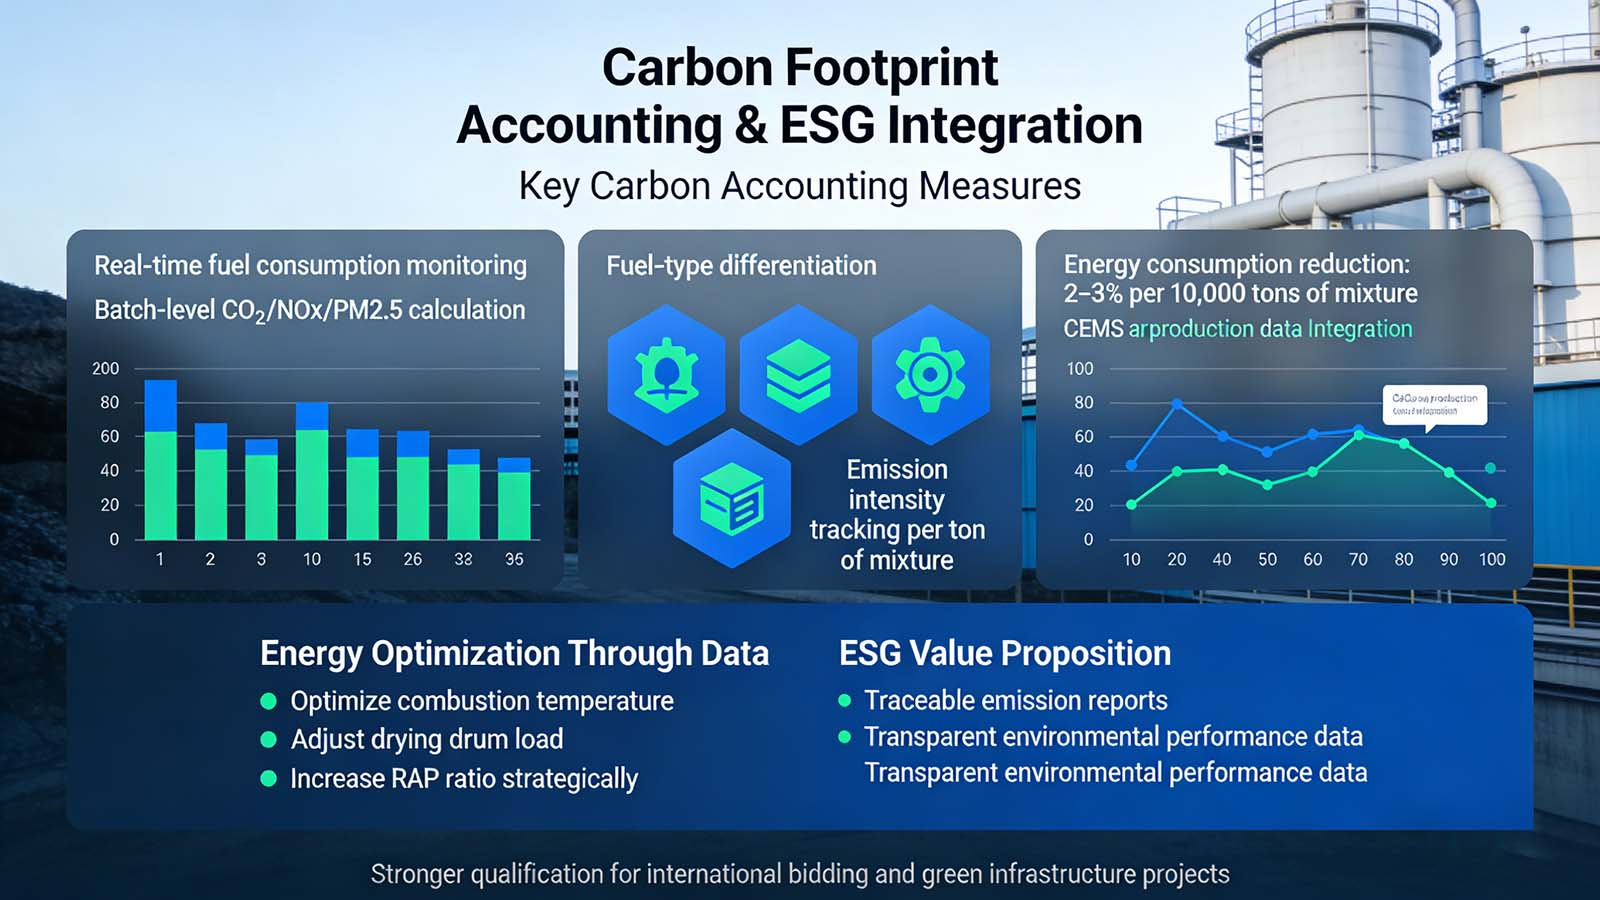
Carbon Footprint Accounting and ESG Integration
International tenders increasingly require measurable carbon performance. Carbon footprint accounting and ESG management are becoming essential.
Carbon Accounting Measures: Real-time monitoring of fuel consumption, Batch-level CO₂, NOx, and PM2.5 calculation, Fuel-type differentiation and Emission intensity tracking per ton of mixture.
Energy Optimization Through Data: By integrating CEMS and production data: Optimize combustion temperature; Adjust drying drum load; Increase RAP ratio strategically; These measures reduce energy consumption by 2–3% per 10,000 tons of mixture.
ESG Value: Traceable emission reports, Transparent environmental performance data and Stronger qualification for international bidding and green infrastructure projects.
Smart Green Factory Development
Smart factory systems enhance production efficiency and carbon control simultaneously.
Automated Production Control
SCADA systems regulate drying drums, burners, aggregate conveying, and mixing processes automatically. This reduces human error and improves stability.
Digitalized Operation
Energy, temperature, and emission data are collected in real time. Operators use the data for predictive maintenance and production optimization.
Intelligent Optimization
Dynamic adjustment of burner load, drying parameters, and dust collection systems increases overall energy efficiency.
Environmental Impact
Energy efficiency increases by 10–15%. CO₂ emissions decrease by 10–12%
| Technology / Measure | Function | Benefit |
|---|---|---|
| Automated Control | SCADA monitoring & regulation | Reduced human error, productivity ↑10% |
| Digital Management | Real-time energy & emission tracking | Precision decisions, energy saving 10–15% |
| Intelligent Optimization | Burner, drying, dust system coordination | CO₂ ↓10–12%, lower VOC emissions |
Leading the Industry Through Green Compliance
The asphalt industry is entering a new era where environmental performance defines market leadership. Companies that act early will gain regulatory security, stronger bidding power, and long-term cost advantages. AIMIX stands ready to support this transformation. We deliver customized, regulation-oriented, and future-ready environmental solutions tailored to your market, capacity, and sustainability goals. Let us work together to build compliant, low-carbon asphalt plants that lead the industry forward.
